
In this tutorial you will learn how to import LiveReport data into Spotfire, save a document as a template in the Spotfire library and open this template in LiveDesign in order to automatically visualize data of a LiveReport by using all the capabilities of Spotfire into the LiveDesign environment.
Import LiveReport data
The first step of a template creation is to load a LiveReport dataset into a Spotfire document.
- Open your Spotfire client (Analyst or Web Player)
- Click on the menu Discngine > LiveDesign Connector to open the panel
- Login to LiveDesign (not required if already connected)
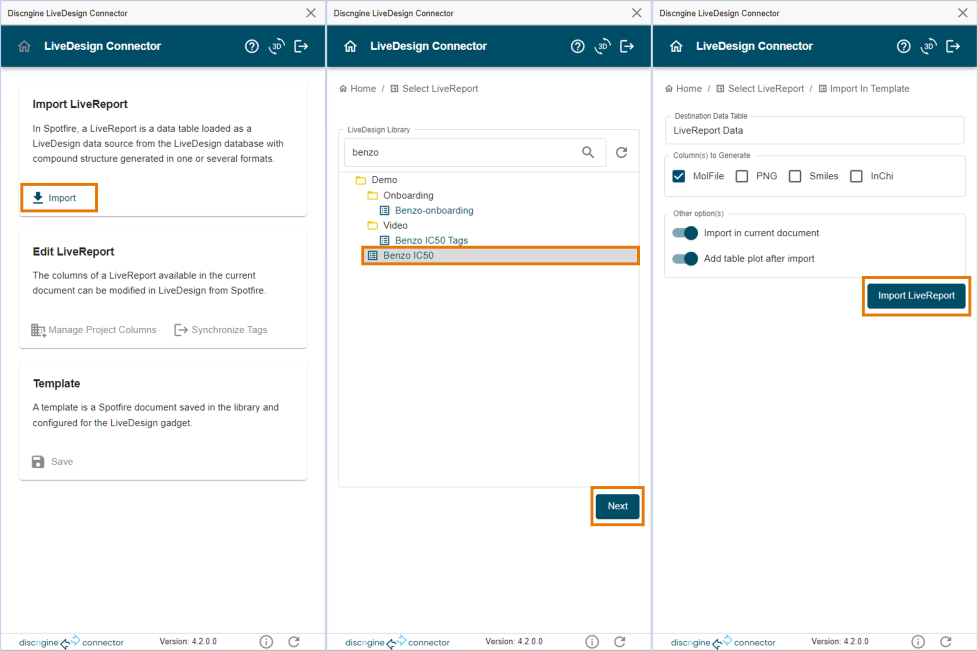
- Click on Import from the home page
- Select the LiveReport to import from the LiveDesign tree (to find it you can filter using its name or id)
- Click on Next
- Keep the default destination data table name to be able to use it in the gadget
- Click on Import LiveReport
See the corresponding documentation for more details about the import options.
Add visualizations
After importing data, all document manipulations can be done as usual. Visualizations can be added, as well as data transformations, data functions or other data sources (databases, files, web services...).
For this tutorial you will simply add two visualizations:
- Add a scatter plot
- Add a bar chart
Save as template
When the analysis is ready, it needs to be saved in the Spotfire library in a specific folder, under a specific path, in order to bind the template to the previously imported LiveReport.
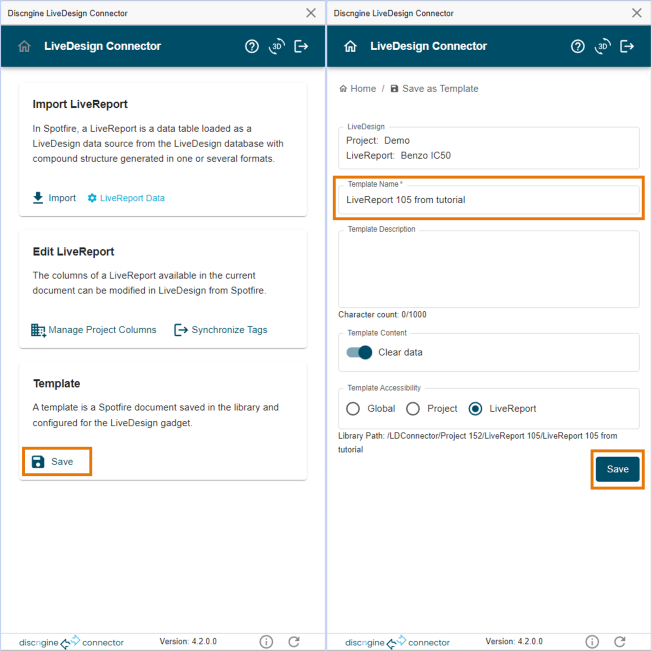
- Click on Save from the home page
- Check the concerned Project and LiveReport
- Change the template name by adding "from tutorial" at the end
- Click on Save
See the corresponding documentation for more details about the save options.
Open in gadget
You can now use the template from the Spotfire Connector Gadget.
- Open your LiveDesign client (use the same URL that the one used to login during the import step)
- Open the LiveReport previously imported into Spotfire
- Open the "Spotfire Connector Gadget" from the Tools left pane (the name can be different depending on your company)
- Select the previously created template named LiveReport
from tutorial (depending on the preferences it may be loaded automatically) - Check that you have a bar chart and a scatter plot and that bi-directional marking is working