In this tutorial you will learn how to run example protocols to load data, edit data and add visualizations to the current document.
Almost all example protocols require a data table containing a column of molecular structures (e.g. CTAB). To have such a column, you will start by loading the "Load Maybridge Data" protocol.
Then, you will run the "Cluster Molecules" protocol consuming these molecular structures.
Materials
Several Pipeline Pilot protocols designed for the SWAPP are provided in the package. The corresponding Pipeline Pilot protocols are in the collection, available under Protocols\Discngine\Spotfire Enabled Protocols\Client Automation\SWAPP Examples. Some of them are saved in the SWAPP menu under a default folder upon installation.
1. Add new data table using "Load Maybridge Data" protocol
-
In Spotfire Analyst, to open the SWAPP, go to Discngine > Web panel > New document
-
In SWAPP menu click on ChemoInformatics > Load Maybridge Data
-
Keep the default value for "Maximum" which is the unique input parameter of this Pipeline Pilot protocol. This is the number of molecules to load from the Maybridge database.

-
Click on "Submit" to execute the protocol.
Once completed, the resulting HTML file from the protocol will be automatically fetched and the new data table "Maybridge-200" will be loaded as well as a table plot named as the data table.
- In SWAPP menu click on ChemoInformatics > Load Maybridge Data again
- Set the "Maximum" input parameter value to 500
- Click on "Submit"
Once completed, a new data table "Maybridge-500" of 500 rows will be loaded, and a table plot of this data table will be displayed.
2. Edit existing data table using "Cluster Molecules" protocol
- In SWAPP menu click on ChemoInformatics > Cluster Molecules
- Select "Maybridge-200" for the "Data Table Name" required input parameter. This is the name of the data table to use as input.
- Click on "Show advanced parameters" to see the advanced parameters of this protocol.
- Click on "Submit"
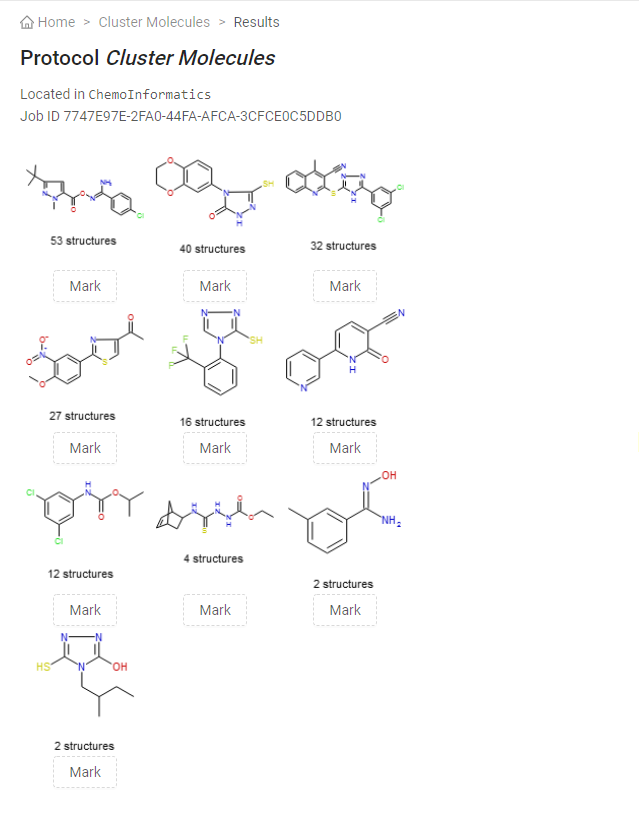
Once completed, new columns will be added to the data table "Maybridge-200" and a bar chart will be displayed. The result page of the protocol contains molecules identified as cluster centers, and the number of structures for each corresponding cluster. The "Mark" buttons under each structure can be used to interact with the SWAPP and mark the relevant rows.

