

Clustering groups the peptides in a report by structural similarity so you can see which families of analogs exist and how their properties differ. It is configured on the Clusters tab of the SAR Report settings drawer, and explored in the Cluster Explorer dialog — whose Summary Table is the main analysis view.
For how the grouping is computed — what "similar" means, what the quality figures tell you, and why the scatter plot is not a picture of the clusters — see Understanding Peptide Clustering.
Step 1: Configure and run clustering
Open Settings → Clusters and turn on Enable clustering. The Run clustering panel appears.
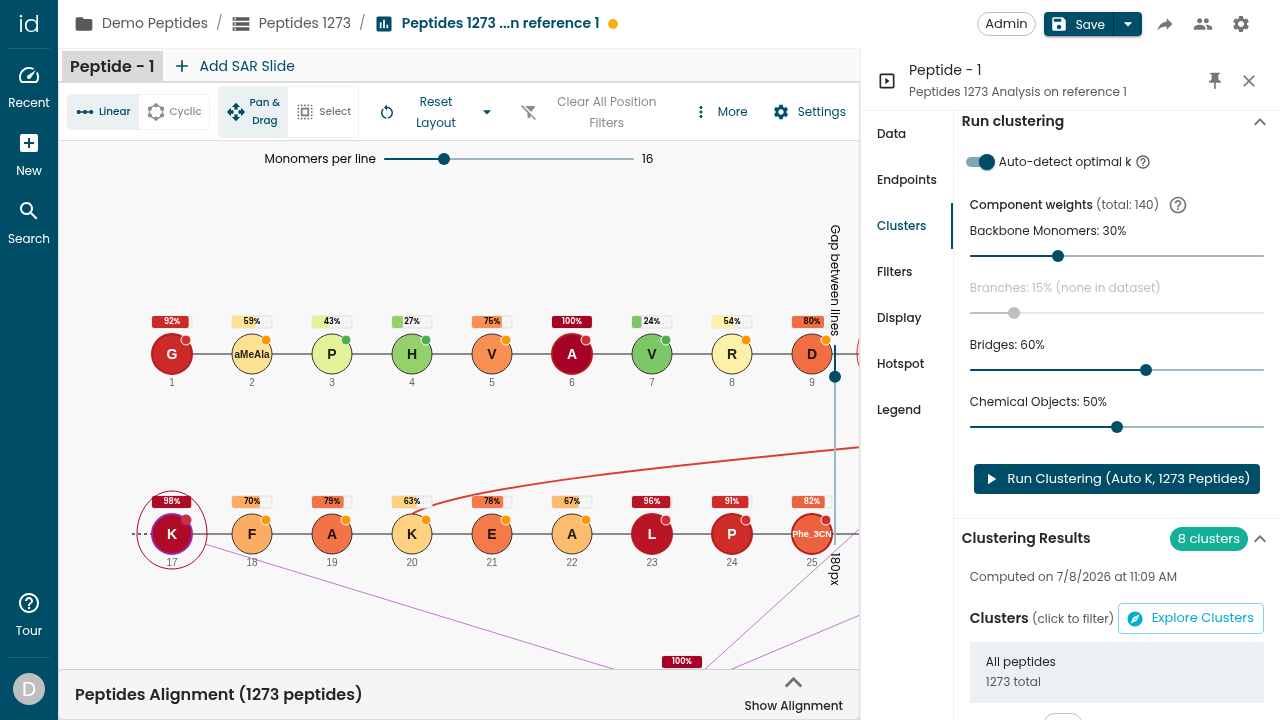
Set:
- Auto-detect optimal k — let Ideation choose the number of clusters (by silhouette score), or turn it off and set Number of clusters with the slider.
- Component weights — how much the Backbone Monomers, Branches, Bridges, and Chemical Objects each contribute to structural similarity. (Branches and Chemical Objects are disabled when the dataset has none.)
Click Run Clustering. When it finishes, the Clustering Results section lists the clusters, each with its size and representative peptide (centroid). Click a cluster to filter the viewer to its members.
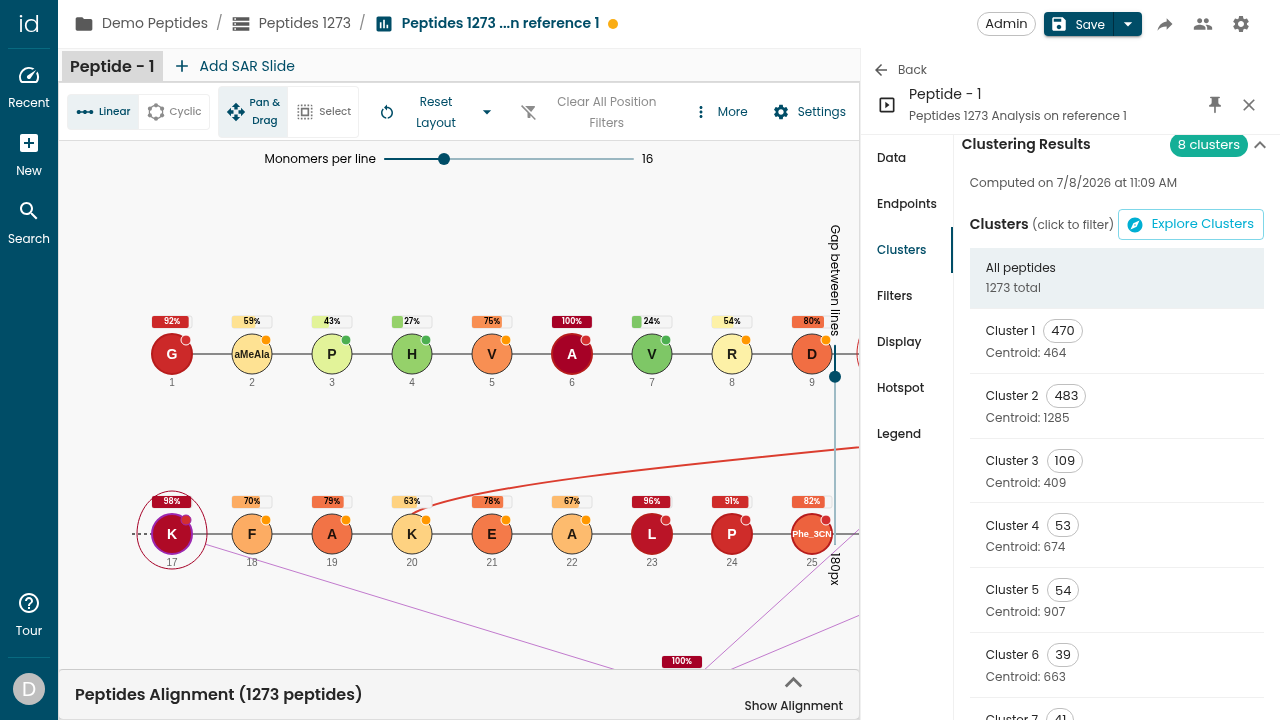
Step 2: Open the Cluster Explorer
Click Explore Clusters to open the full-screen Cluster Explorer. It has a Clustering Configuration panel on the left (adjust weights and re-run without leaving the dialog), tabbed views in the centre, and a Cluster Selection / Filter panel on the right that lists every cluster (size and medoid) and ends with Apply To Viewer and Export All Clusters.
The tabs are: Summary Table, UMAP - 2D View, UMAP - 3D View, Comparison Matrix, Property Distributions, Parallel Coordinates, and Silhouette Analysis.
Step 3: Read the Summary Table (the main view)
The Summary Table tab (subtitle "Cluster statistics comparison") is the most important view — it compares every cluster side by side, one cluster per row.
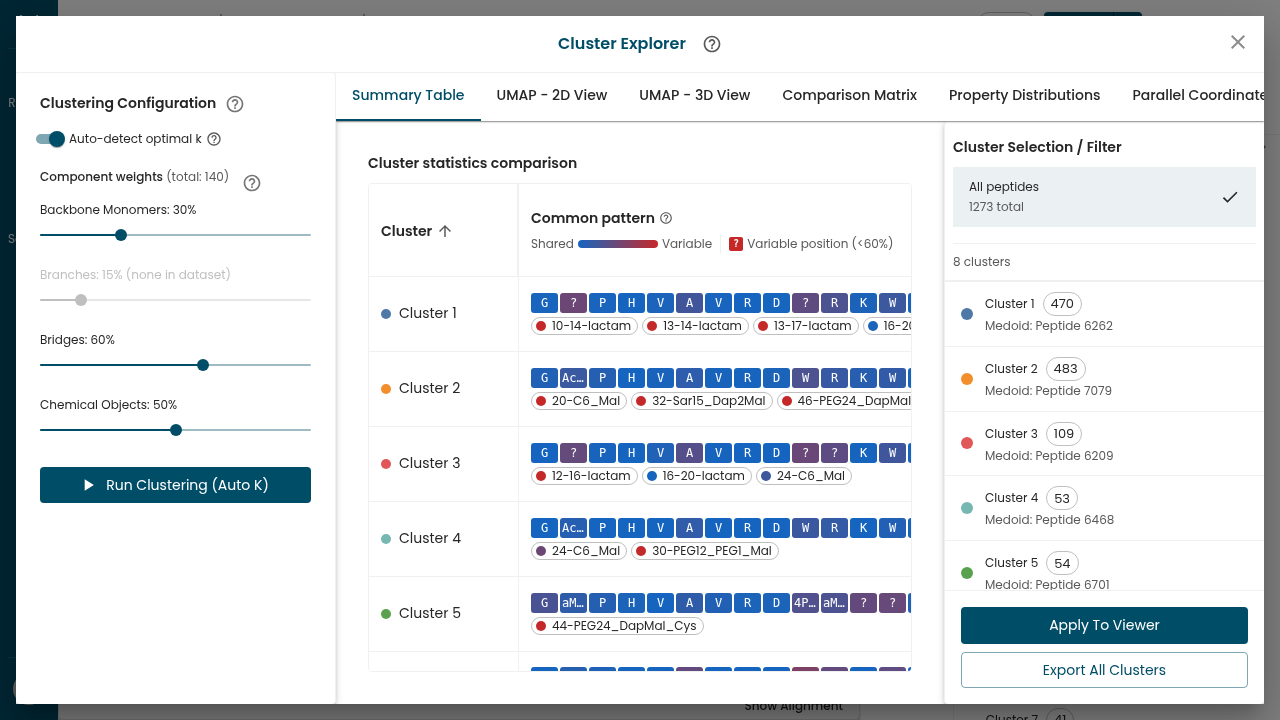
Read it column by column:
| Column | What it tells you |
|---|---|
| Cluster | The cluster label with its colour (stays fixed while you scroll). |
| Common pattern | The cluster's consensus sequence — the most common monomer at each position, plus shared bridges and chemical objects. A Shared → Variable color gradient marks how conserved each position is, and a ? marks a variable position (< 60% conserved). This is the structural motif the cluster represents. |
| Quality | The cluster's silhouette band — Good (≥ 0.5), Fair (≥ 0.25), or Poor — with the score. Higher means a tighter, better-separated cluster. |
| Peptides count | How many peptides are in the cluster. |
| Outliers | Members that fit poorly (negative silhouette) — a high count means a loosely defined cluster. |
| Monomers / Bridges / Chemical objects (avg) | Average structural counts per cluster. |
| One box-plot per property | The distribution of each numeric property, drawn on a shared scale down the column so clusters compare directly (with mean ± std). |
Scroll the table right to reach the per-property box-plot columns:
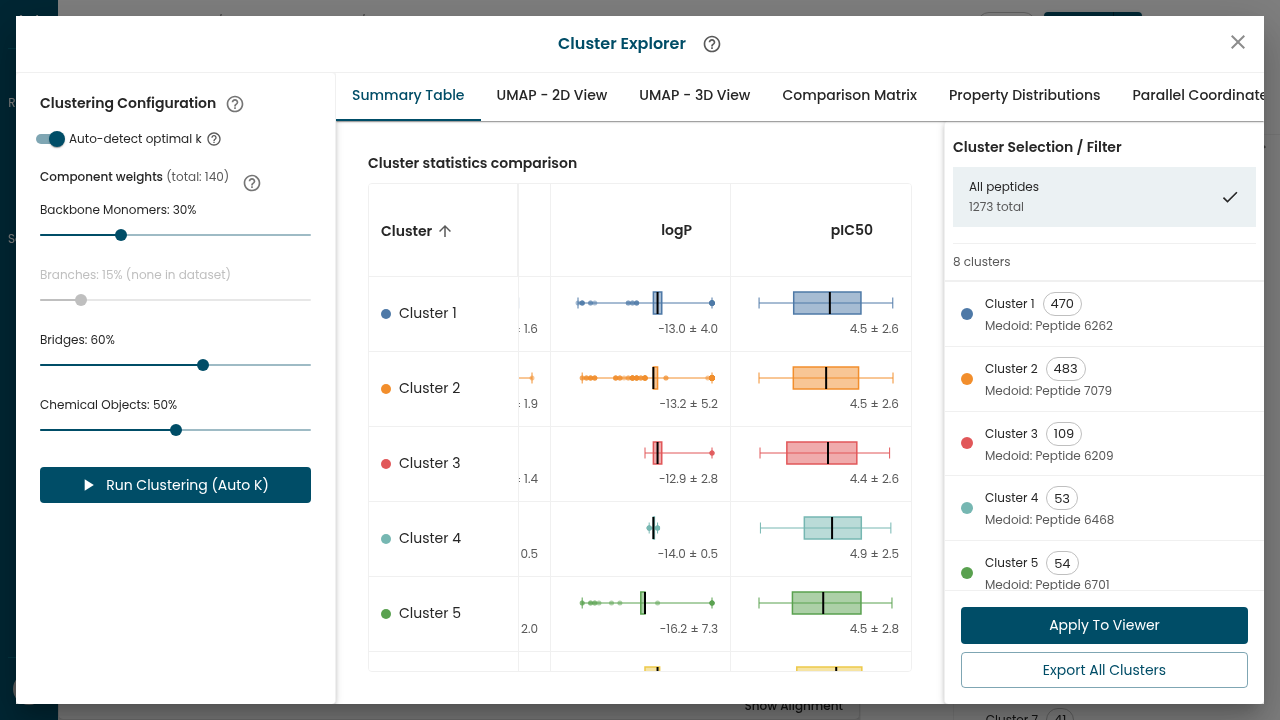
Columns are sortable and resizable.
Reading the common patterns
- Scan the Common pattern column to identify the motif each cluster represents — this is the structural family the cluster captures.
- Use Quality and Outliers to judge how tight each cluster is before trusting it.
- Read a property's box-plot column top-to-bottom to link a structural pattern to an activity trend — for example a cluster whose
pIC50box-plot sits higher than the others points to a promising sub-series. - Act on a finding: select the cluster and click Apply To Viewer to filter the canvas to it, or Export All Clusters to take the assignments away.
Step 4: Use the other tabs
The remaining tabs give complementary views. The UMAP - 2D View projects the peptides into two dimensions and colors them by cluster, giving a rough map of which peptides share composition (the n_neighbors and min_dist sliders tune the projection):
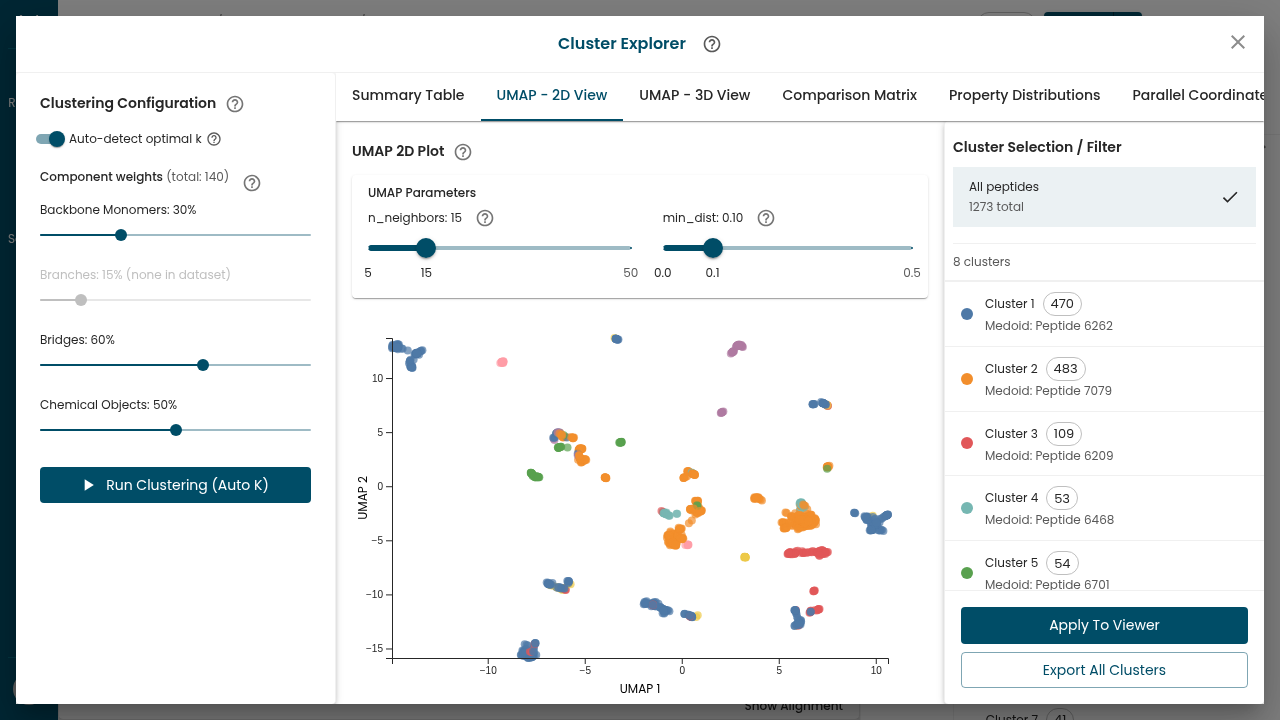
The projection is computed from a different, position-blind representation than the clustering itself, so a cluster may legitimately look scattered and two clusters may legitimately appear to overlap. Use the Summary Table's quality column, which is derived from the real clustering distances. See Understanding Peptide Clustering.
UMAP - 3D View is the three-dimensional equivalent, Comparison Matrix shows inter-cluster distances, Property Distributions and Parallel Coordinates compare properties across clusters, and Silhouette Analysis shows per-cluster quality. Cluster selection inside the dialog stays local until you click Apply To Viewer.
Next steps
- Understanding Peptide Clustering — how the grouping and the quality figures are computed
- How to Analyze Hotspots and Synergies
- Understanding Peptides in Ideation