
Hotspot analysis scores how much each position (and optionally bridges, chemical side chains, and regions) impacts a chosen endpoint. Synergy analysis goes further and finds combinations of positions that act together. Both are configured on the Hotspot tab of the SAR Report settings drawer. This guide covers every option in detail.
For how the scores are computed and how to avoid over-reading them — why some element always reads 100%, what a N/A synergy means, and why strength is not activity — see Understanding Hotspots and Synergies.
How hotspot analysis works
Hotspot analysis identifies the positions with the highest structure-activity relationship (SAR) impact by measuring how much a property varies across the different residues (variants) seen at each position.
For each position, the algorithm:
- Groups the peptides by their variant at that position.
- Computes a baseline using the selected aggregation method (average, median, or the reference peptide's value).
- Calculates the range of variant deviations from that baseline.
- Computes a delta for each variant (variant's displayed value − baseline). The variant's displayed value follows the endpoint's aggregation (max, min, average, median; histogram uses the average, boxplot the median) — see How to Explore the Peptide Viewer.
- Normalizes the impact to 0–100% against the largest range in the dataset.
For a region (a group of positions), the algorithm first builds a structural fingerprint combining every monomer, chemical object, and bridge inside the region, groups peptides by that fingerprint, and then scores impact with the same aggregation and normalization as a single position.
A higher impact means residue substitutions at that spot move the property more — making it a key target for optimization.
Enable hotspot analysis
Open Settings → Hotspot and turn on Enable Hotspot Analysis. Impact bars and significance badges immediately appear on the canvas.
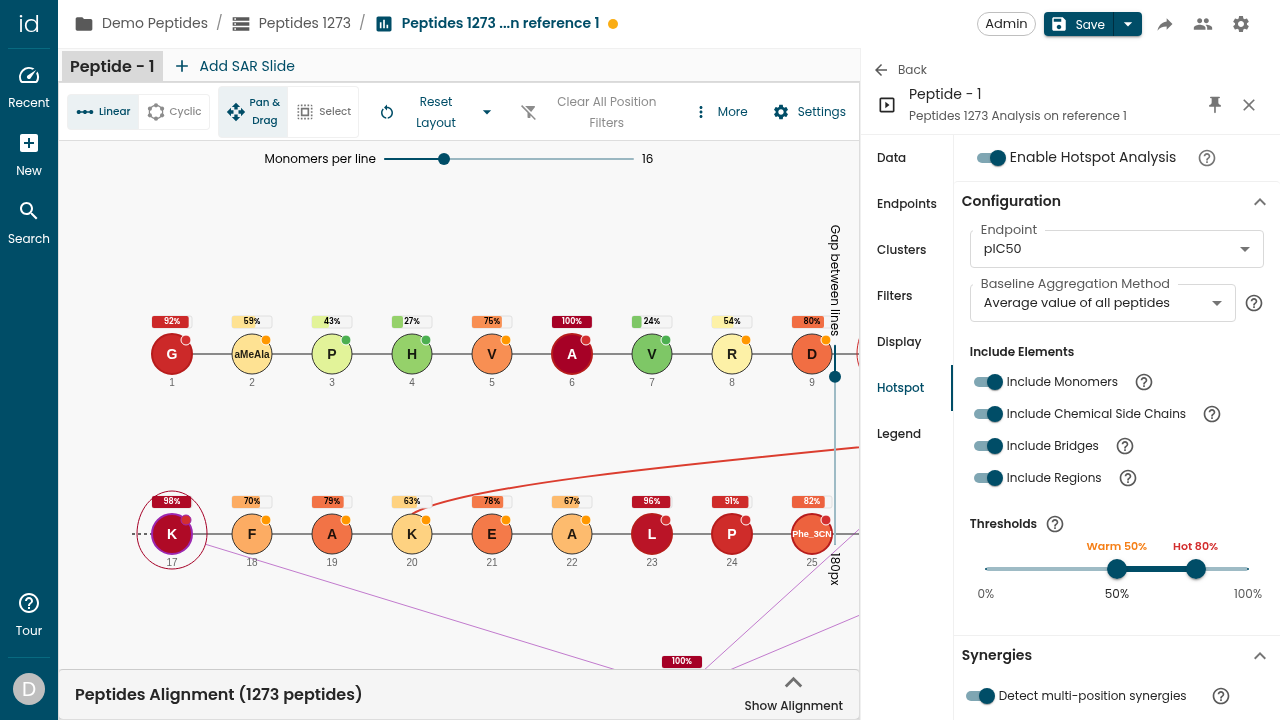
Configure the analysis
Endpoint
The numeric endpoint to score (for example pIC50). Only numeric endpoints are selectable.
Baseline Aggregation Method
How the baseline that variants are compared against is computed. This affects both the gallery deltas and the impact scores.
| Method | Baseline |
|---|---|
| Average value of all peptides | The mean of all peptide values at the position. |
| Median value of all peptides | The median of all peptide values at the position. |
| Reference peptide value | The value of the reference peptide (set on the Data tab). |
Include Elements
Choose which element types get hotspot scoring, coloring, bars, and badges:
| Toggle | Applies hotspot analysis to… |
|---|---|
| Include Monomers | Amino-acid positions. |
| Include Chemical Side Chains | Side chemical chains, each scored as a whole chain. |
| Include Bridges | Disulfide and lactam bridges. |
| Include Regions | Grouped regions (scored via the region fingerprint). |
Thresholds
A dual-handle slider (0–100%) that sets the Warm and Hot cut-offs used to classify each element. The defaults are Warm 50% and Hot 70%:
- Hot — impact ≥ the Hot threshold (high impact).
- Warm — Warm threshold ≤ impact < Hot threshold (moderate impact).
- Cold — impact < the Warm threshold (low impact).
Read the results
Each included element on the canvas shows:
| Cue | Meaning |
|---|---|
| Impact bar | A horizontal bar filled to the element's relative impact (0–100%); the fill color reflects strength. Shows the quantitative magnitude. |
| Significance badge | 🔴 Hot, 🟠 Warm, 🟢 Cold — at the default thresholds, ≥ 70%, 50–70% and < 50% respectively. Shows the qualitative classification. |
| Gallery deltas | In galleries: green + = higher activity, red − = lower activity, grey 0.0 = no change. Delta = variant value − baseline. |
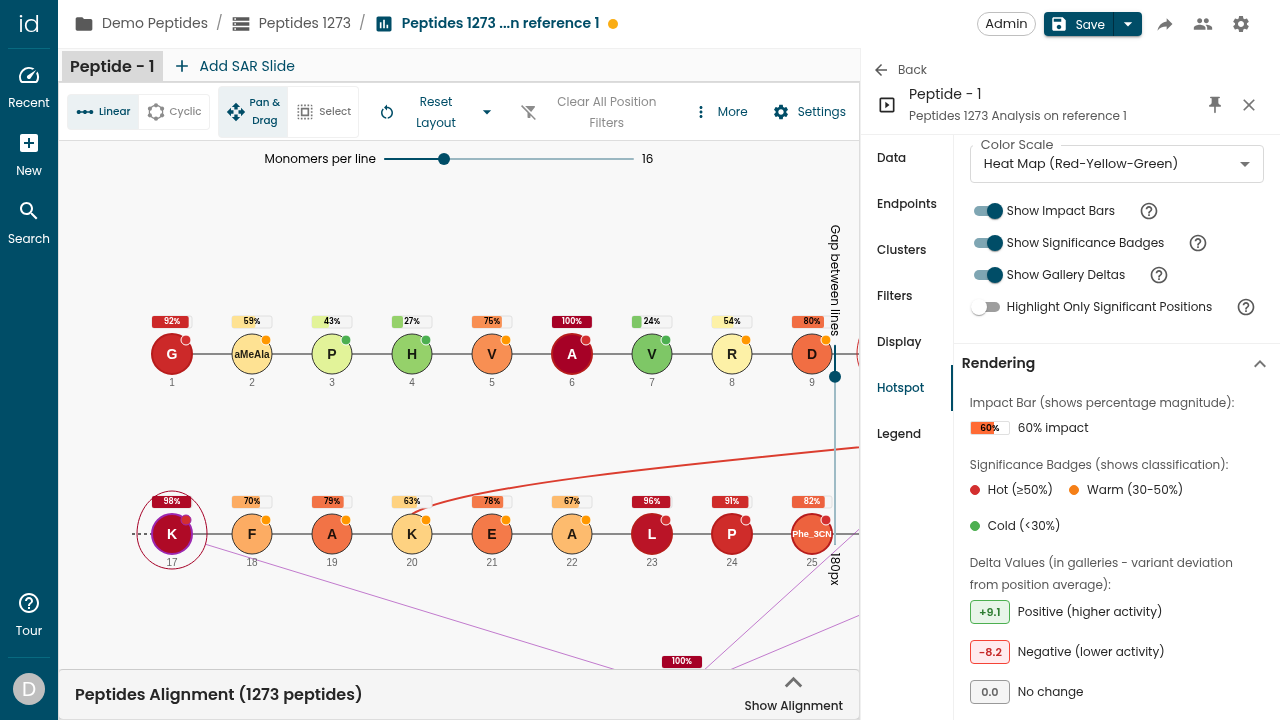
The Display options section controls how results are drawn:
| Option | Effect |
|---|---|
| Color Scale | The impact color ramp: Heat Map (Red-Yellow-Green), Viridis (Purple-Green-Yellow), or Red-Blue. |
| Show Impact Bars | Show/hide the 0–100% impact bars. |
| Show Significance Badges | Show/hide the Hot/Warm/Cold dots. |
| Show Gallery Deltas | Show/hide the per-variant delta values in galleries. |
| Highlight Only Significant Positions | When on, only Hot and Warm elements are styled; Cold elements stay plain, so the impactful spots stand out. |
With hotspot enabled, the Display tab also gains a Hotspot option under Color monomers by.
How synergy detection works
Single-position hotspot analysis scores each position on its own, so it cannot see positions that only matter in combination. Synergy detection fills that gap:
- Peptides are grouped by the combination of residues at a set of 2–3 positions (or a contiguous region).
- An additive prediction is built for each combination: the overall mean plus each position's individual effect.
- The synergy is how far the combination's observed activity deviates from that additive prediction — a consistent gap is the interaction signal.
Interaction types:
- Synergistic — together more active than the sum of the individual effects (the positions reinforce each other).
- Antagonistic — together less active than expected (the positions interfere).
- Neutral — activity matches the additive prediction.
Each detected synergy is drawn as a region on the viewer (for example "Synergy 2 + 5").
Detect multi-position synergies
In the Synergies section, turn on Detect multi-position synergies.
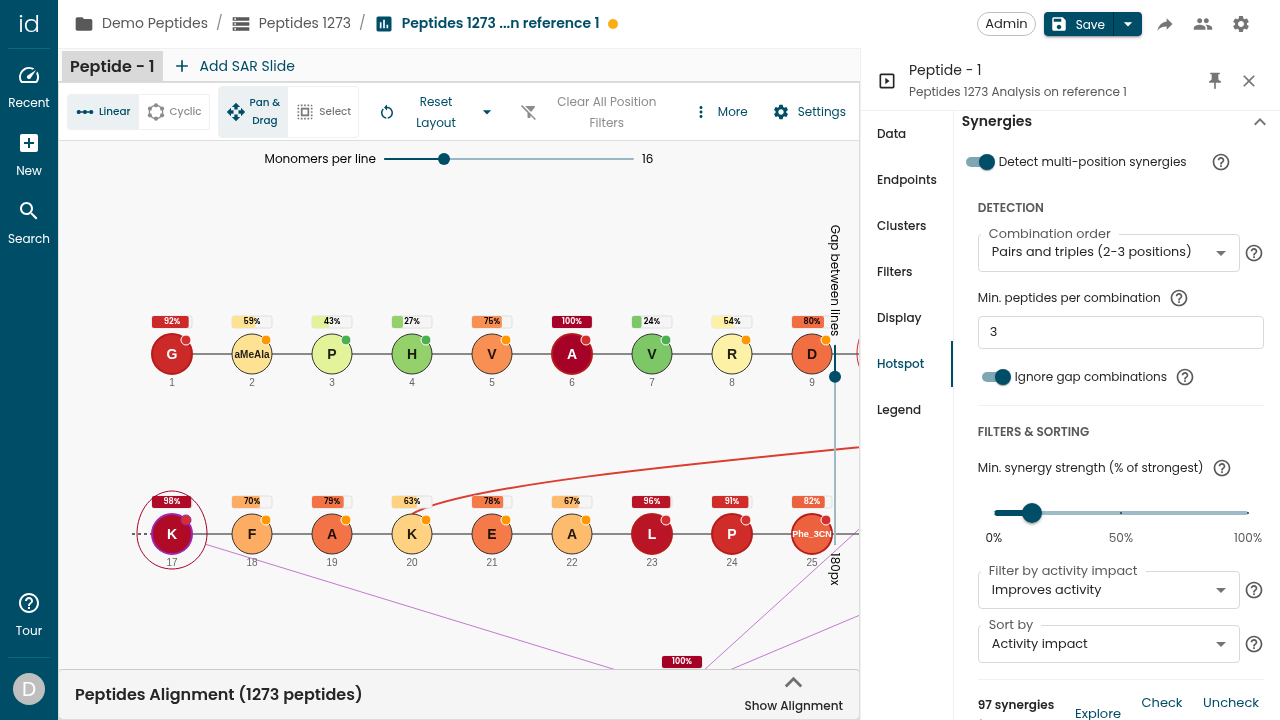
Detection options
| Option | What it controls |
|---|---|
| Combination order (default Pairs and triples) | How positions are grouped: Pairs only (2), Pairs and triples (2–3), Triples only (3) — these may be non-adjacent — or Contiguous regions, which scans adjacent stretches of monomers (useful for motif-like synergies longer than 3). |
| Region length range (regions mode only, default 2–6) | The shortest and longest contiguous run of monomers to scan. Longer regions need more peptides sharing the same motif, so they are often dropped for low support. |
| Min. peptides per combination (default 3) | The minimum number of peptides that must share the same variant combination for it to count. Higher = more reliable but needs more data; combinations below it are ignored. |
| Ignore gap combinations (default on) | Exclude combinations that include an empty position (a gap / "None"), so synergies are scored only on actual residue combinations. |
Filter and sort the synergies
| Control | What it does |
|---|---|
| Min. synergy strength (% of strongest) (default 70%) | Hides synergies below a minimum interaction strength. Each set's raw score is the support-weighted RMS of its combinations' residuals (observed − predicted), scaled against the strongest set of the same size (pairs, triples, and regions each scaled to their own strongest). 0% lists everything; 100% keeps only the strongest. This is interaction strength, not activity. |
| Filter by activity impact | Any activity (all), Improves activity (only sets with a combination that is both synergistic and more active than the baseline), or No activity gain (sets that interact but not toward a more active combination). |
| Sort by | Strength (relative magnitude), Most synergistic (largest share of synergistic combinations), Most antagonistic (largest share of antagonistic combinations), or Activity impact (best synergistic + active combination first). |
Each detected synergy is also drawn as a region on the viewer, connecting its positions (for example Synergy 10 + 30). Clicking one opens a synergy region gallery:
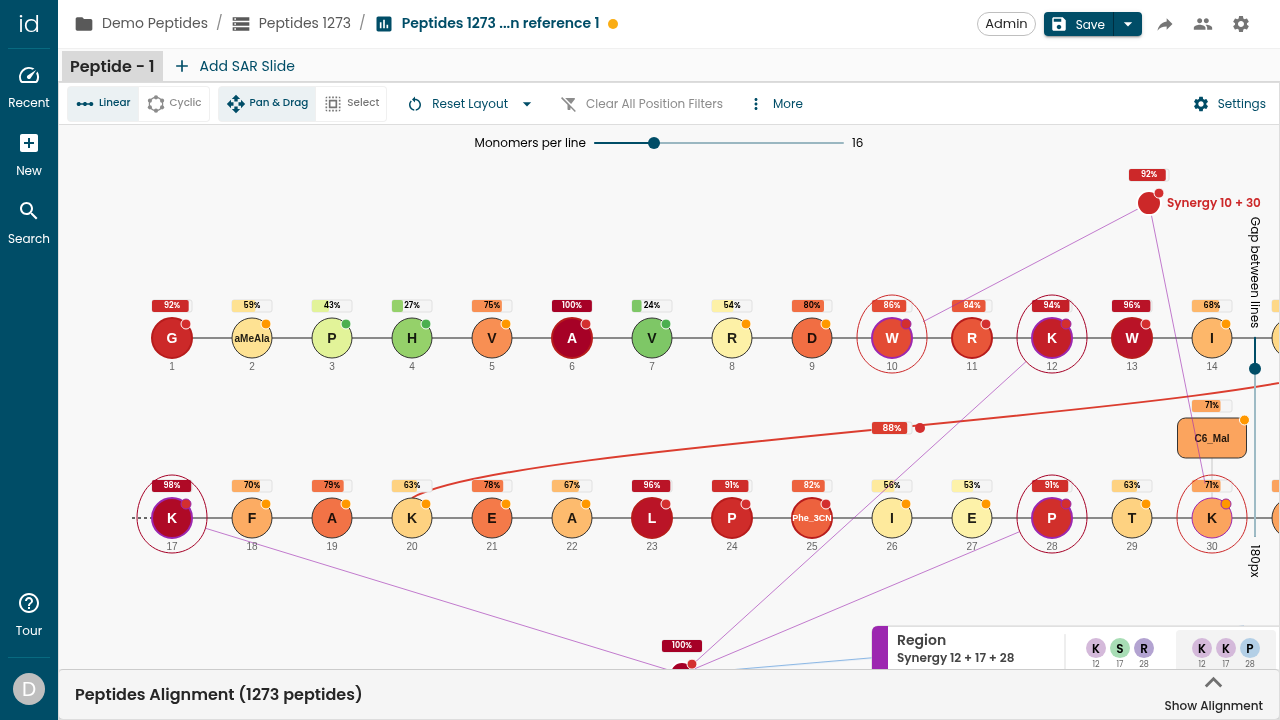
The synergy list shows a count ("N synergies found") and one row per synergy:
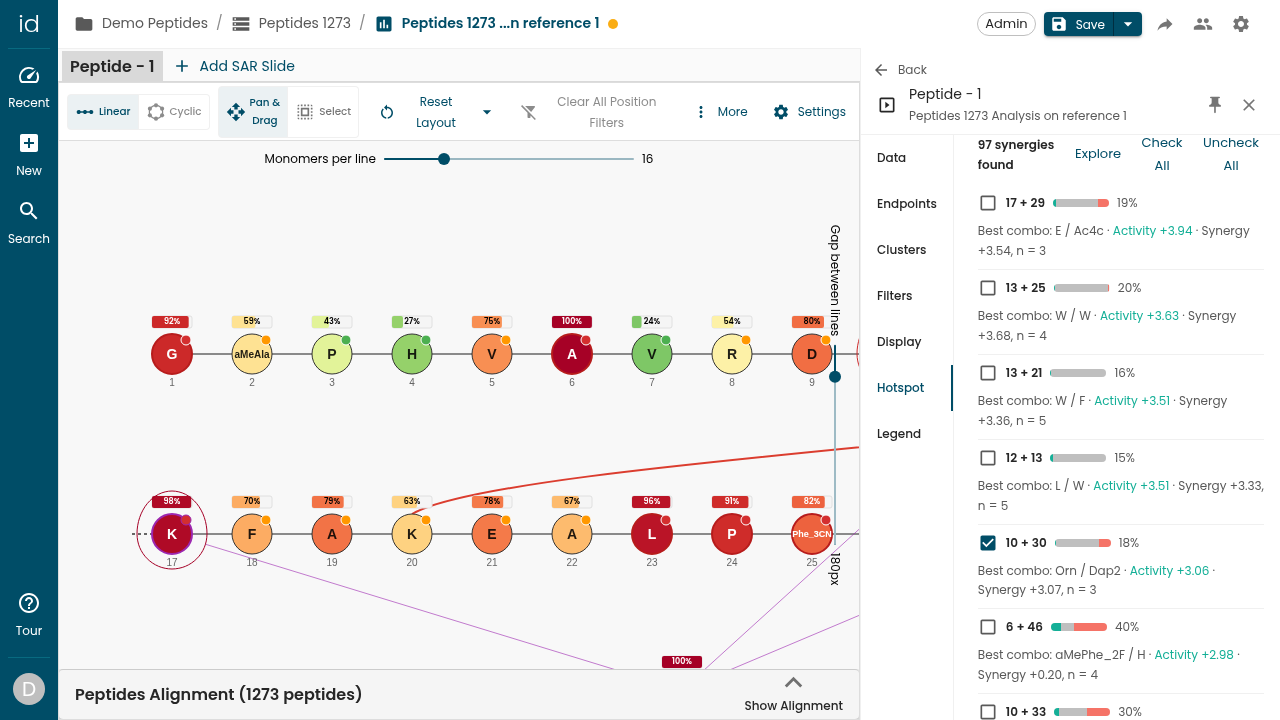
Each row has a checkbox (show the synergy as a region on the viewer), the positions, a direction bar (green synergistic / grey neutral / red antagonistic), the strength %, and the best combination — its residues, the Activity and Synergy deltas, and the supporting peptide count n. Until you tick or untick a row yourself, only the three sets at the top of the list, in its current sort and filter, are drawn on the viewer. Use Check all / Uncheck all to toggle every row currently listed, and Explore to open the combinations table. Deleting a synergy region from its right-click menu on the canvas unticks its row.
If nothing meets the settings you will see "No synergy found" — lower the Min. synergy strength or Min. peptides per combination, change the activity filter, or add more peptides.
Explore synergy combinations
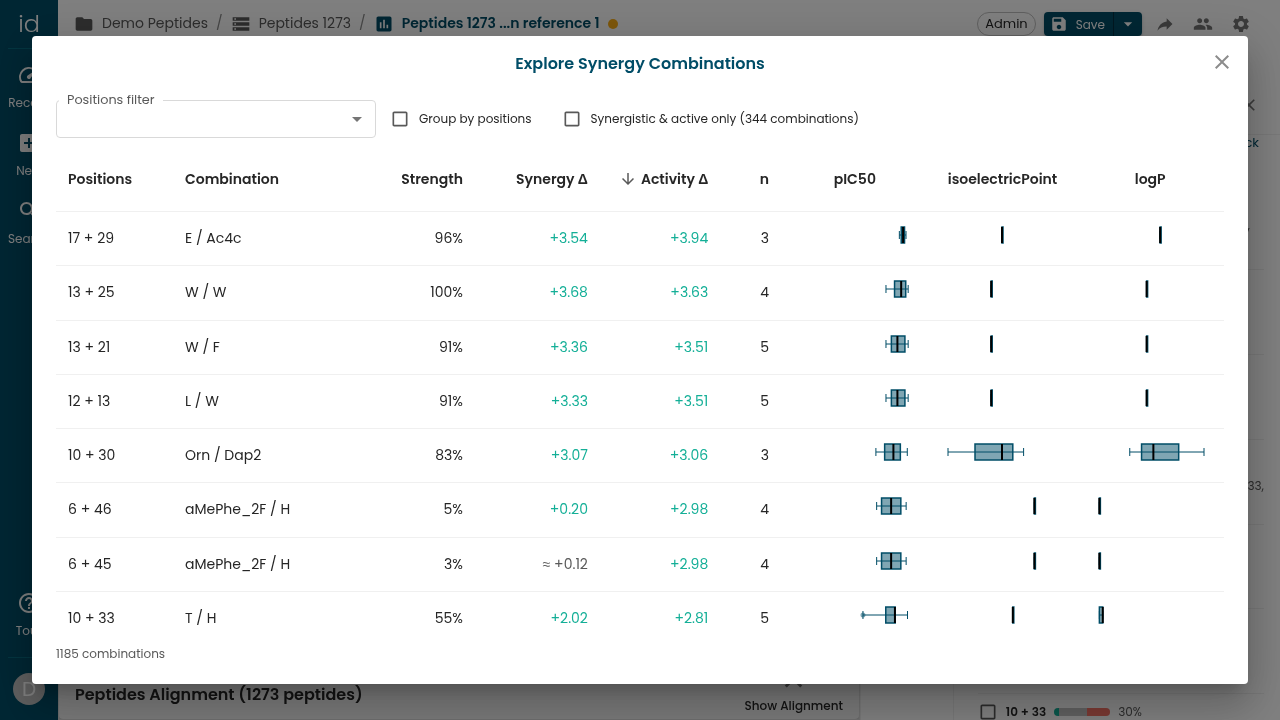
Click Explore to open the Explore Synergy Combinations dialog — a sortable table of every combination across the listed synergies. Each row shows the Positions, the residue Combination, its Strength, the Synergy Δ and Activity Δ, the supporting peptide count n, and a box-plot per property. Use Group by positions and Synergistic & active only to focus the table, and click a column header to sort.
Next steps
- Understanding Hotspots and Synergies — how the scores are computed and how to read them
- How to Cluster Peptides
- Understanding Peptides in Ideation