
Check your error message
A lot of possible errors are currently logged and notified to the user. By reading the message, through the notification, you can handle by yourself some of these errors.
For example, in the error below, you can see that there was a timeout during the login process :
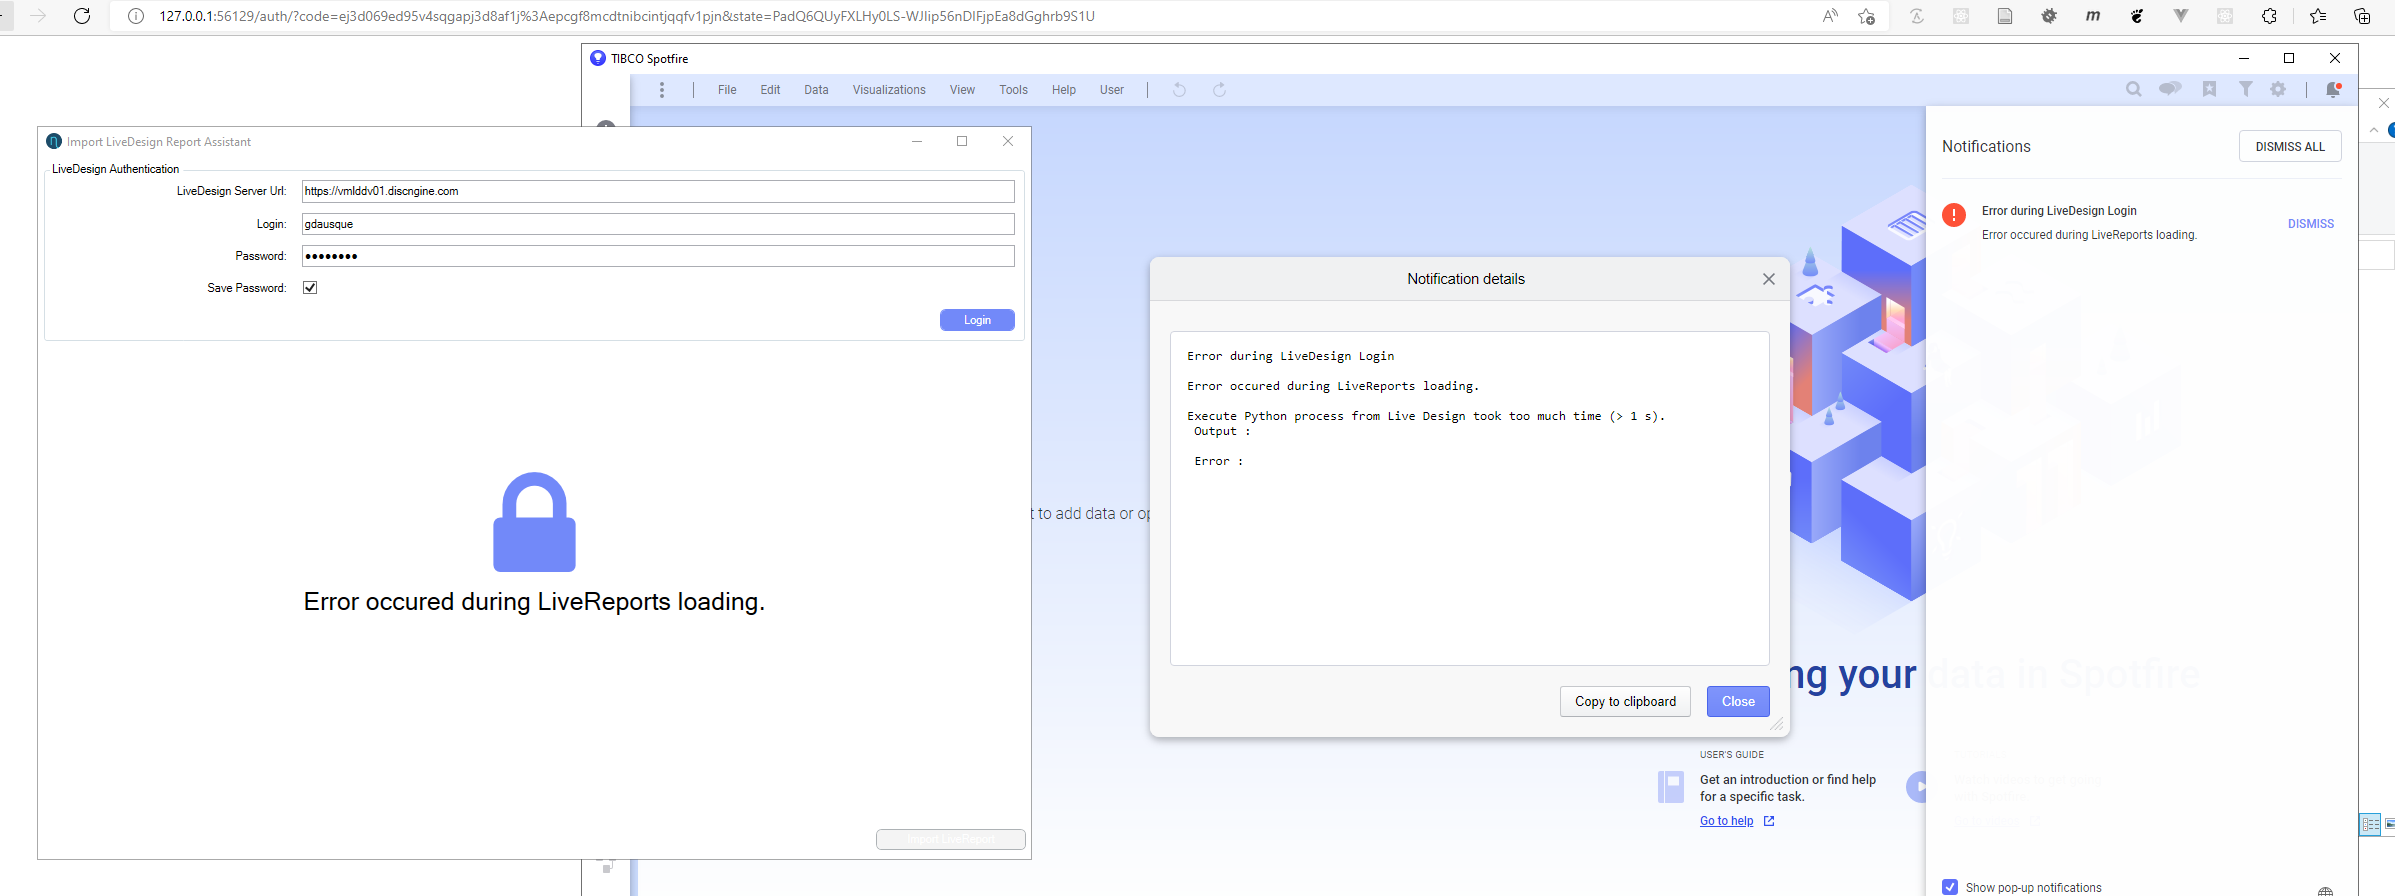
In this case, you have to increase the timeout value defined in the Spotfire preferences (see the installation documentation).
Check version of deployed gadget and Spotfire extension
This information can be very useful to help solve an issue after an update.
In Analyst :
- Go to Help > Support diagnostic and logging
- Note the version of the following assemblies :
- ClientAutomationCommon.Core
- Discngine.DataSource.LiveDesign
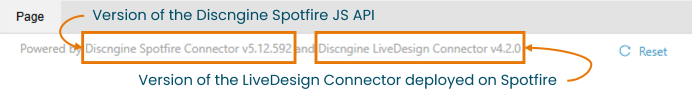
From the Gadget :
- Check the bottom of the gadget :
Use the diagnostic tool
If the Connector doesn't work correctly, you can use the diagnostic tool to make a first level diagnostic on the installation and configuration of the Connector.
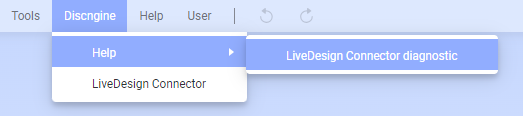
To use the diagnostic tool, launch Spotfire Analyst and go to Discngine > LiveDesign Connector diagnostic tool.
If you have not yet made the necessary settings, follow the diagnostic tool configuration guide.
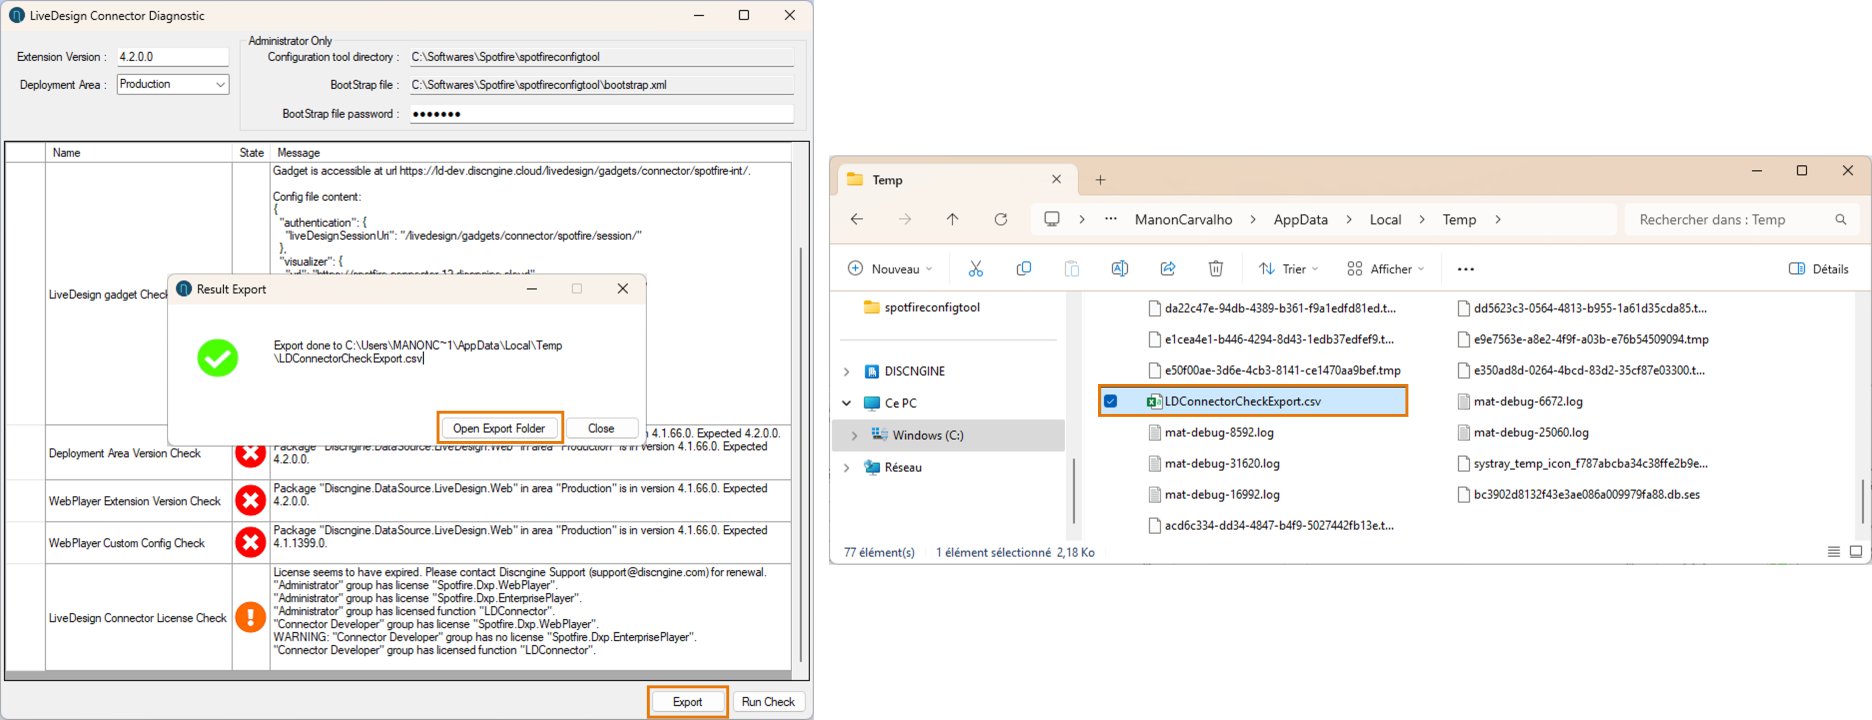
Run the diagnostic by clicking on the "Run Check" button. All configured diagnostics start running.
When the diagnostics are complete, a report is available for each control and its status. In the event of an error or warning, a message helps you to understand and resolve the issue.
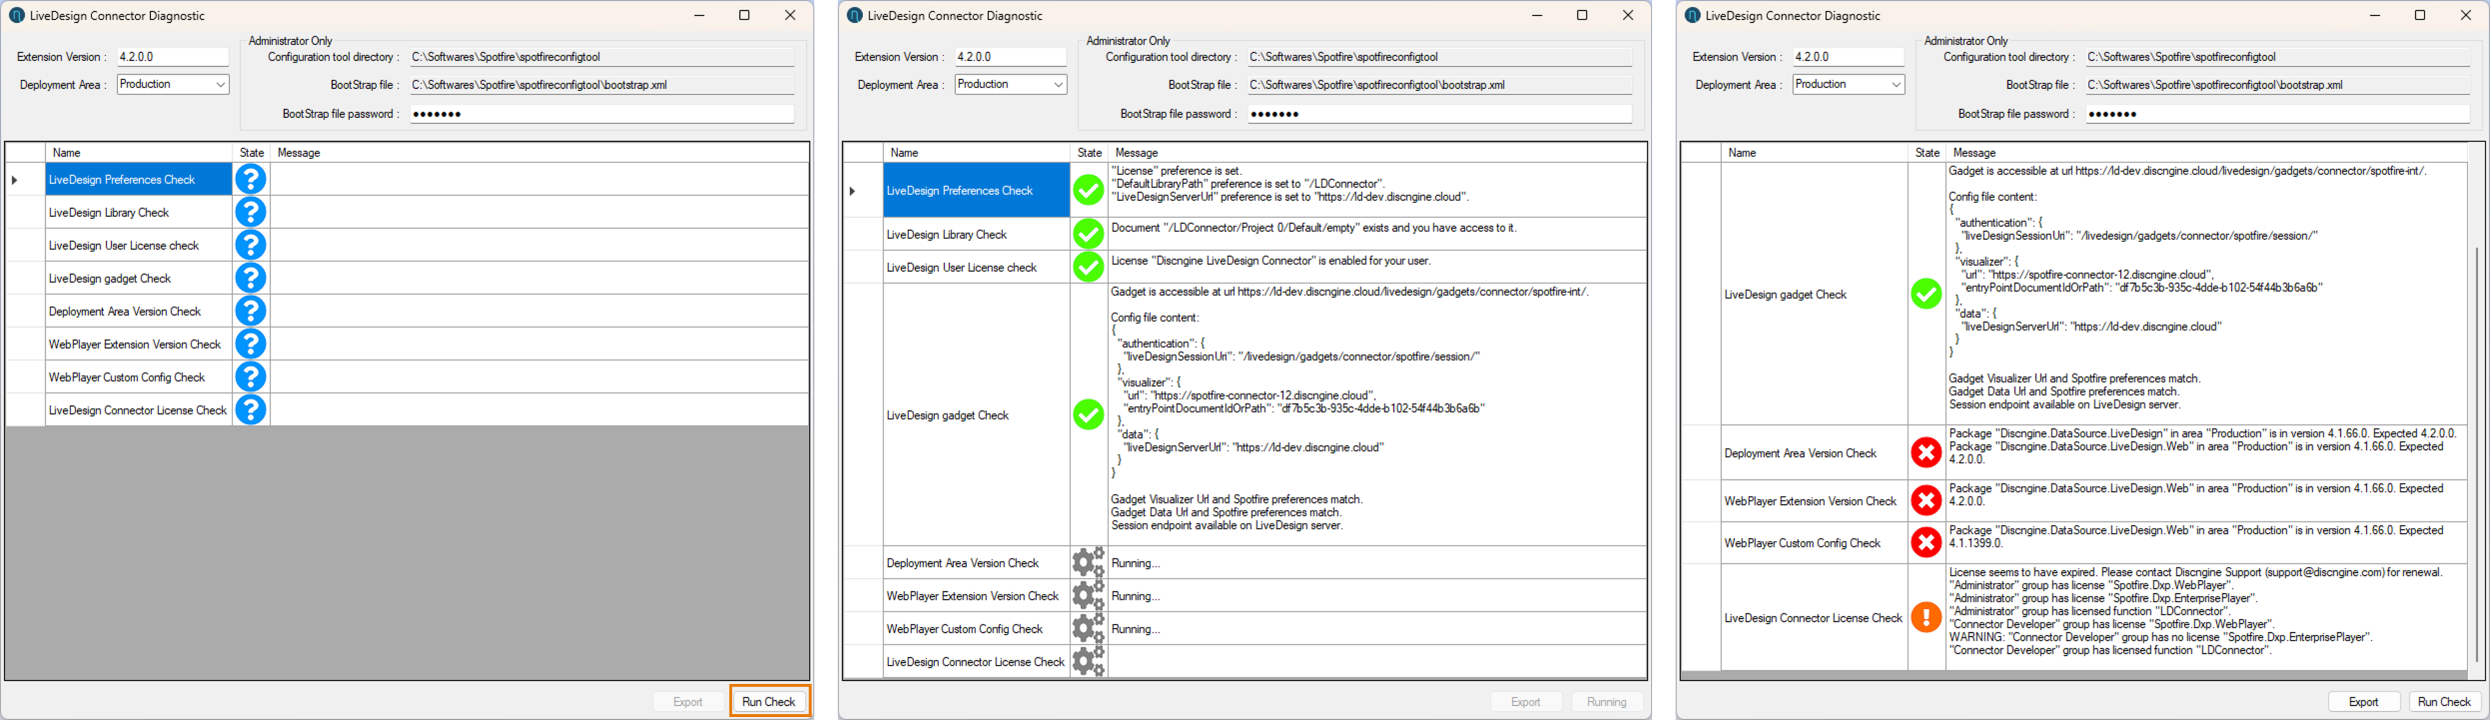
You can also export the diagnostic results in CSV format to send it to support@discngine.com.
Click on "Export" to generate the CSV file. It is saved in the temporary folder of your account in the LDConnectorCheckExport.csv file.
You can click on "Open Export Folder" to open the folder location.
Check the LiveDesign configuration
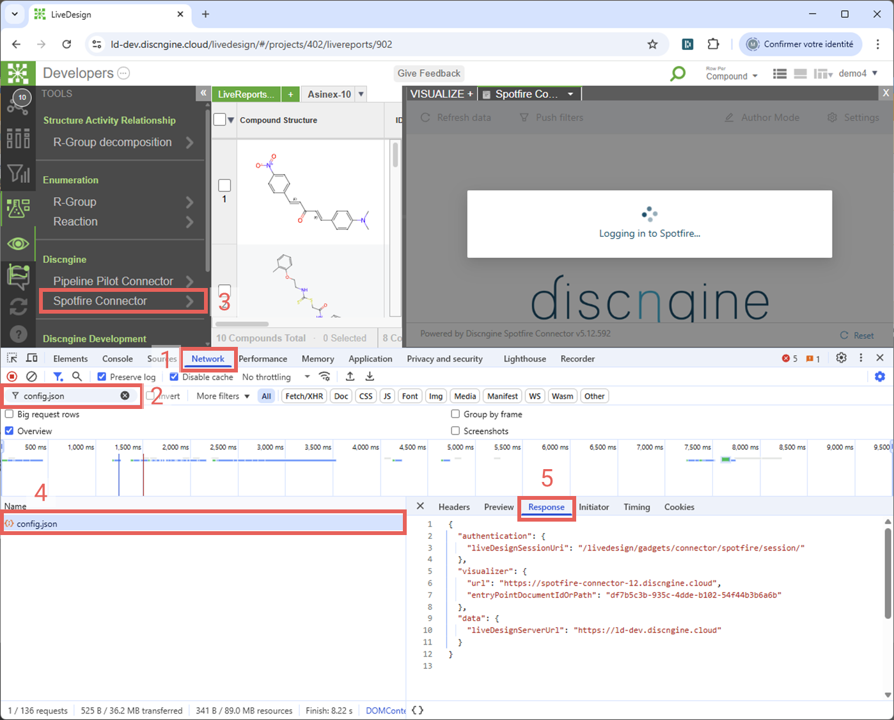
When the gadget is not working properly, you can check the config.json file.
Get the config file
From LiveDesign interface:
- Open the DevTools (Ctrl F12 or Right click and Inspect) and go to the Network tab
- Filter on config.json
- Open the Spotfire gadget (the name might be different than the one in the screenshot)
- Click on the config.json entry which just appeared
- Open the Response tab
Points of attention
liveDesignServerUrlvalue must be the same than the first part of the URL in your browservisualizer > urlvalue should be the Spotfire server where the Connector is installed and, most of the time, it should not end with a slash- The
entryPointDocumentIdOrPathvalue must be the GUID of an accessible Spotfire document - Pasting
liveDesignServerUrlvalue followed byliveDesignSessionUrivalue in a browser should display a page with a long string- If you get a 404 error code, then the
liveDesignSessionUrivalue is wrong - If you get another error code, like 503, there might be an issue with the LiveDesign nginx server
- If you get a 404 error code, then the