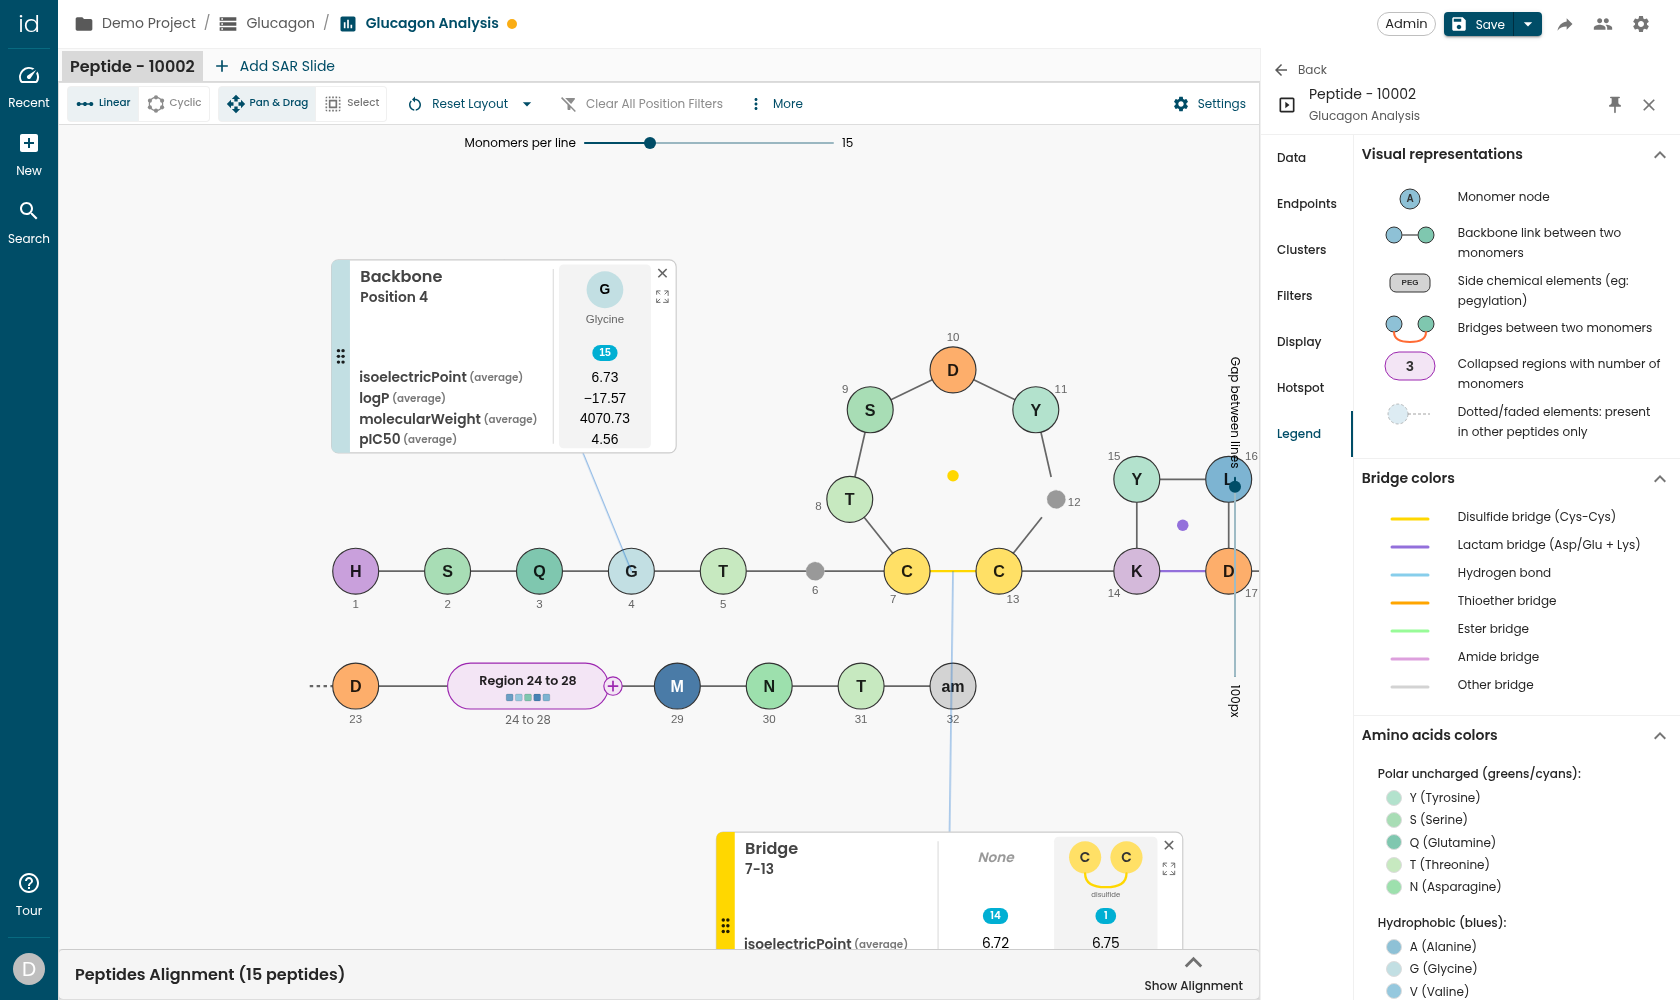
The peptide viewer is the interactive canvas of a SAR Slide. It draws the reference peptide's backbone, branches, bridges, and chemical objects, and lets you inspect the variants observed across all aligned peptides. This guide covers navigating the canvas, selecting monomers, working with regions, reading branches and bridges, reading side chemical chains, expanding monomers, cyclizing, opening galleries, choosing how endpoints are summarized, and the display options.
Each viewer canvas is one SAR Slide — a tab in the report. Use the tabs to switch between slides, or Add SAR Slide to create a new one.
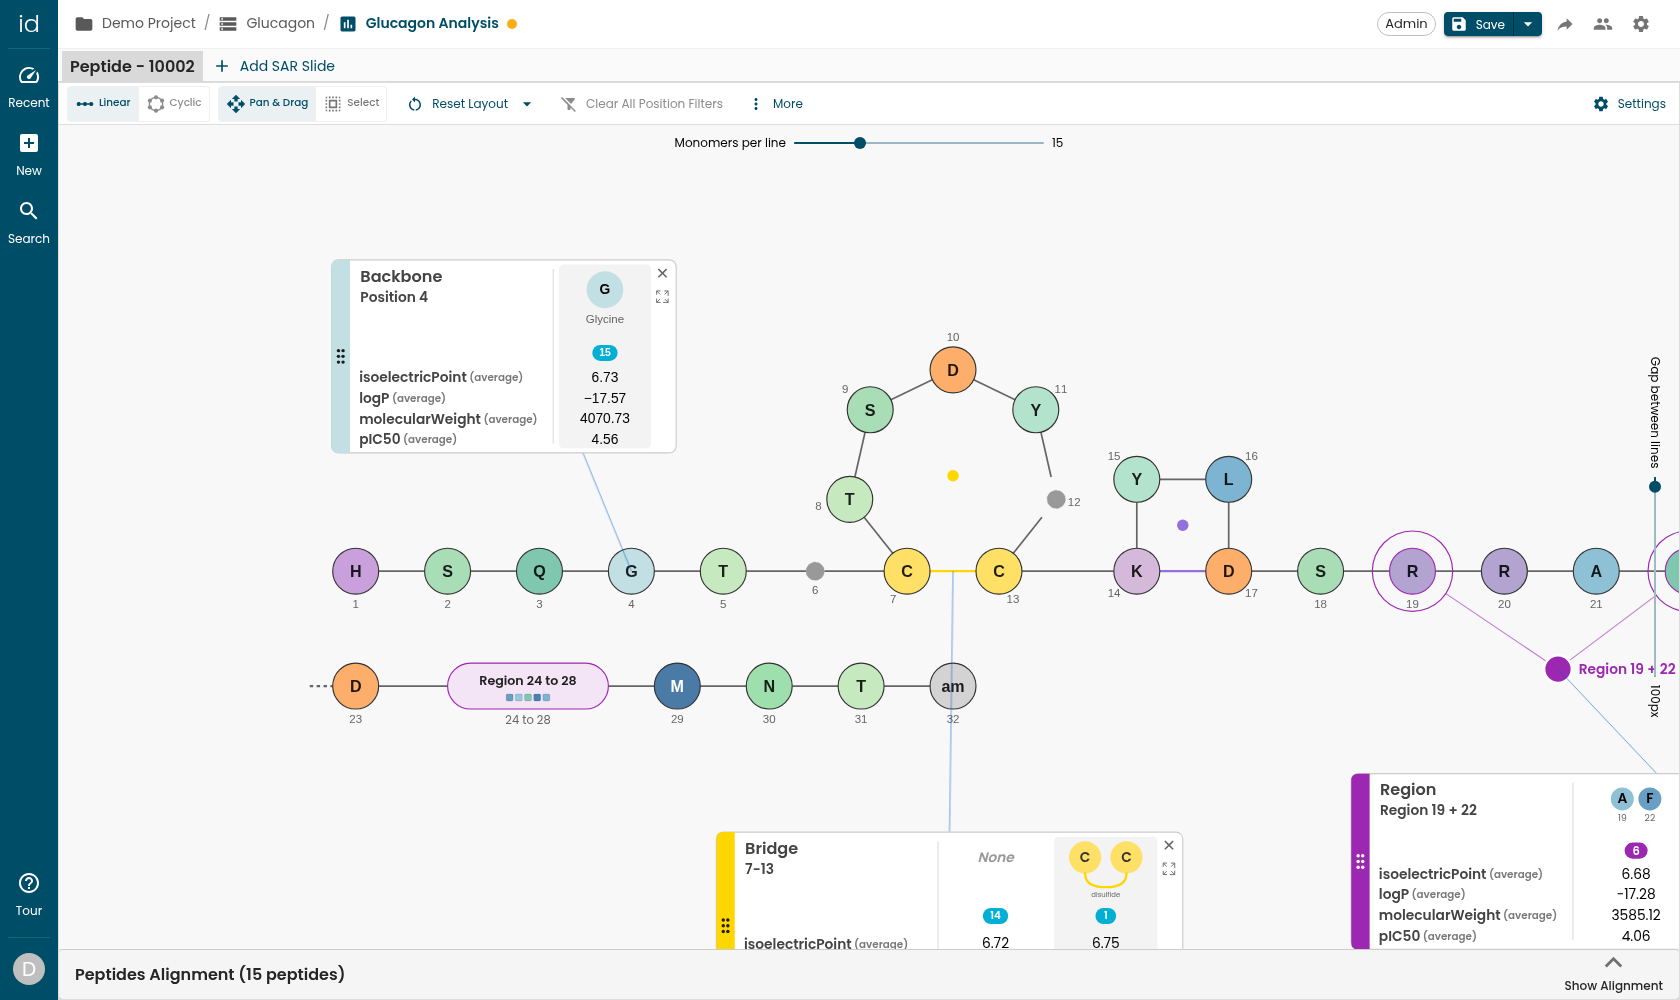
Navigate the canvas
The toolbar (top of the canvas) controls layout and interaction. Its five menus open when you hover their button (a click works too) and close when the pointer leaves:
| Control | What it does |
|---|---|
| Pan & Drag | Zoom and pan the canvas; drag monomers, chemical objects, bridge linkers, and regions to reposition them. |
| Select | Enter selection mode (or hold Ctrl while in Pan & Drag). |
| Linear / Cyclic | Switch between the linear (line-wrapping) layout and a circular layout. Shown only for a macrocyclic reference peptide, which opens in Cyclic layout the first time; a linear peptide is always drawn linearly. |
| Layout menu | Reset Layout (or Reset to Saved Layout once a layout is saved), Save Layout, Reset to Default Layout, the Smart Guides checkbox, and Hide All Galleries. |
| Monomers menu | Expand All Monomers, Collapse All Monomers, Select All Monomers (switches to Select mode with every residue selected), Unselect All. |
| Regions menu | Collapse All Regions, Expand All Regions, Delete All Regions. Greyed out while the canvas has no region. |
| Bridges menu | Cyclize All Bridges, Uncyclize All, Expand All Linkers, Collapse All Linkers. Greyed out when the peptide has no bridge; the linker items when no bridge runs through a chemical linker. |
| Chem chains menu | Group All Chains, Ungroup All Chains, Expand All Chems, Collapse All Chems. Greyed out when the peptide has no chemical object. |
| Clear position filters | Remove every per-position variant filter, including side-chain and bridge filters. Appears only while a filter is active. |
| Download as image | Save the canvas as an image. |
| Settings | Open the SAR Report settings drawer (Data, Endpoints, Clusters, Filters, Display, Hotspot, Legend). |
Every menu item that would do nothing is greyed out, and its tooltip says why (No cyclized bridge, Nothing is selected). Right-click an empty spot of the canvas for the same groups as submenus, plus the mode and layout switches, Download as image, and — while something is selected — a Selection (n) submenu holding every action of the selection toolbar.
Two sliders on the canvas control the linear layout: Monomers per line (across the top) sets how many monomers appear before the backbone wraps to the next line, and Gap between lines (down the right edge, in px) sets the vertical spacing between the wrapped lines.
While Smart Guides is on, anything you drag — a monomer, a multi-selection, a region, a region segment, a cyclization hub, or a gallery — locks onto the axes of the surrounding elements as it comes close: monomer rows and columns, the next regular slot after the end of a chain, and region pill edges and centres. A dragged gallery aligns to monomers and to the other open galleries. A dashed line shows the axis it locked onto; release to drop the element exactly on it. Turn it off from the toolbar's Layout menu or in Settings → Display for free pixel placement.
Select monomers
Enter selection by clicking Select in the toolbar (or hold Ctrl while in Pan & Drag mode). A Selection Options panel appears with a Selection Mode toggle: Rectangle or Lasso.
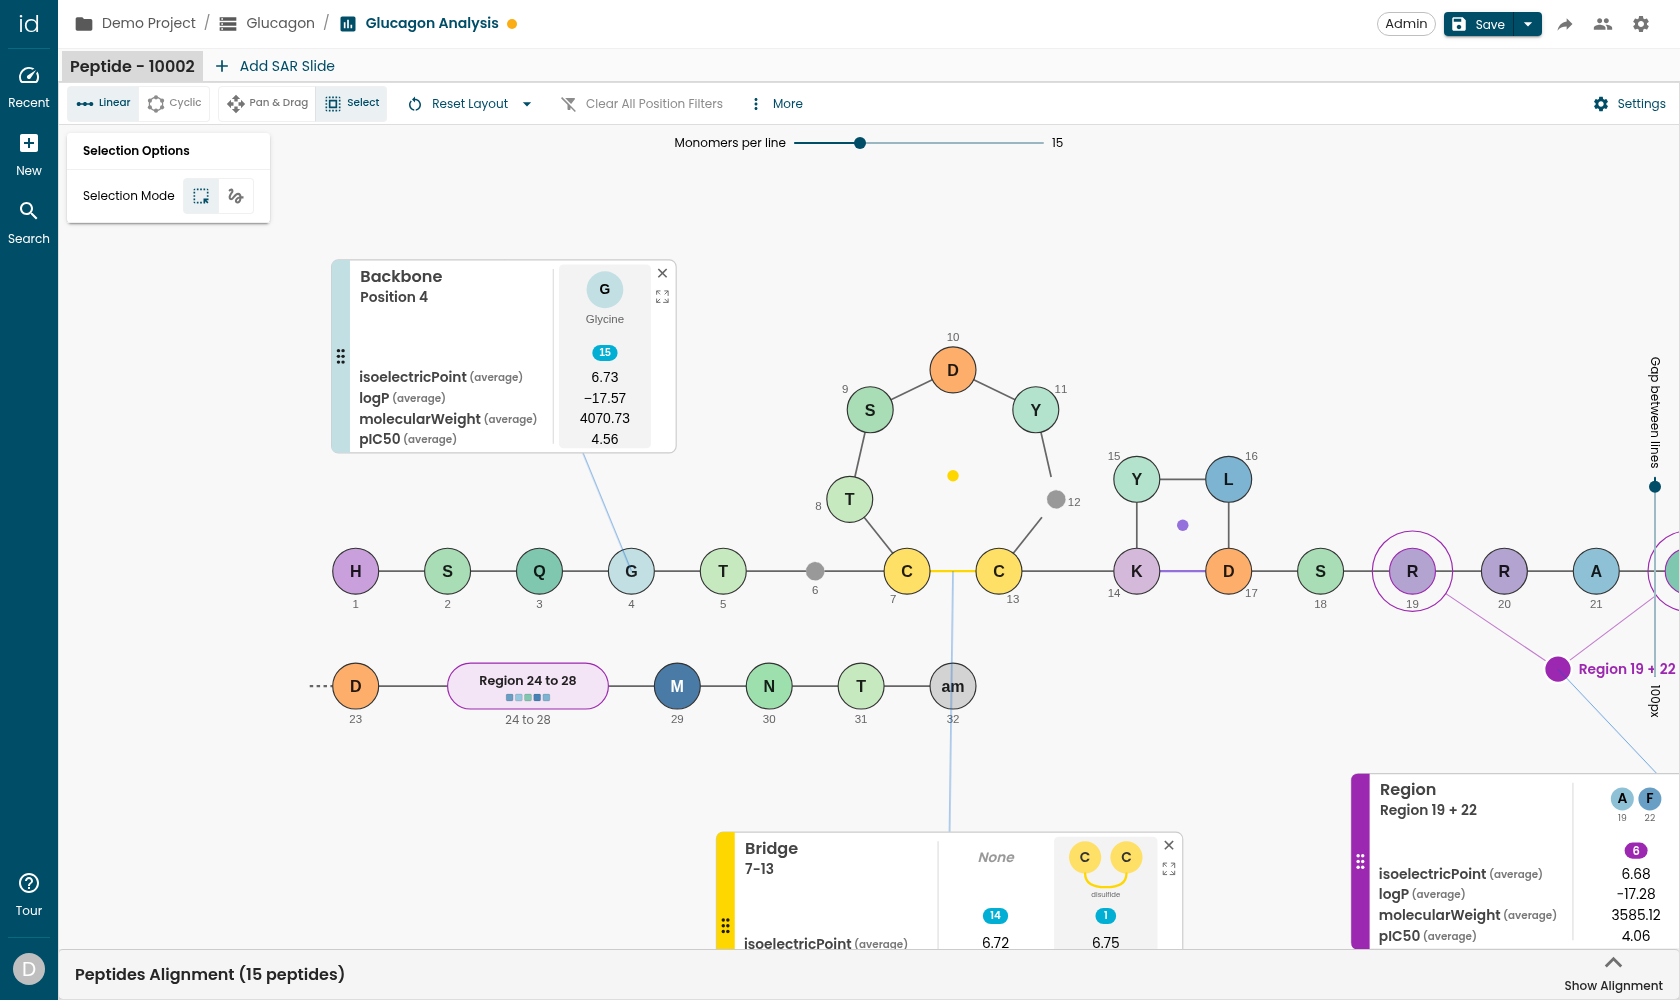
You can build a selection in several ways:
- Click a monomer, a chemical object, or a bridge linker to select it.
- Hold Ctrl and click more elements to add them to the selection.
- Use Select All Monomers in the toolbar's Monomers menu to select every residue at once.
- Drag on the canvas (rectangle or lasso, per the Selection Mode) to select a set at once.
- Click an empty area of the canvas without Ctrl to clear the selection.
With elements selected you can, from the selection toolbar or the Selection (n) submenu of the canvas right-click menu, create a region, cyclize the selection, expand or collapse the selected elements (chemical objects and bridge linkers included), reset the layout of the selection, keep only the selection variable, or unselect all. Create Region and Cyclize Selection show the number of residues they will act on; chemical objects and linkers do not count towards a region.
Work with regions
A region groups positions (contiguous or not) so you can collapse them into a single pill, analyze them together, filter them, and show them as one gallery.
- Create a region by selecting monomers and choosing Create Region.
- Manage a region by right-clicking it:
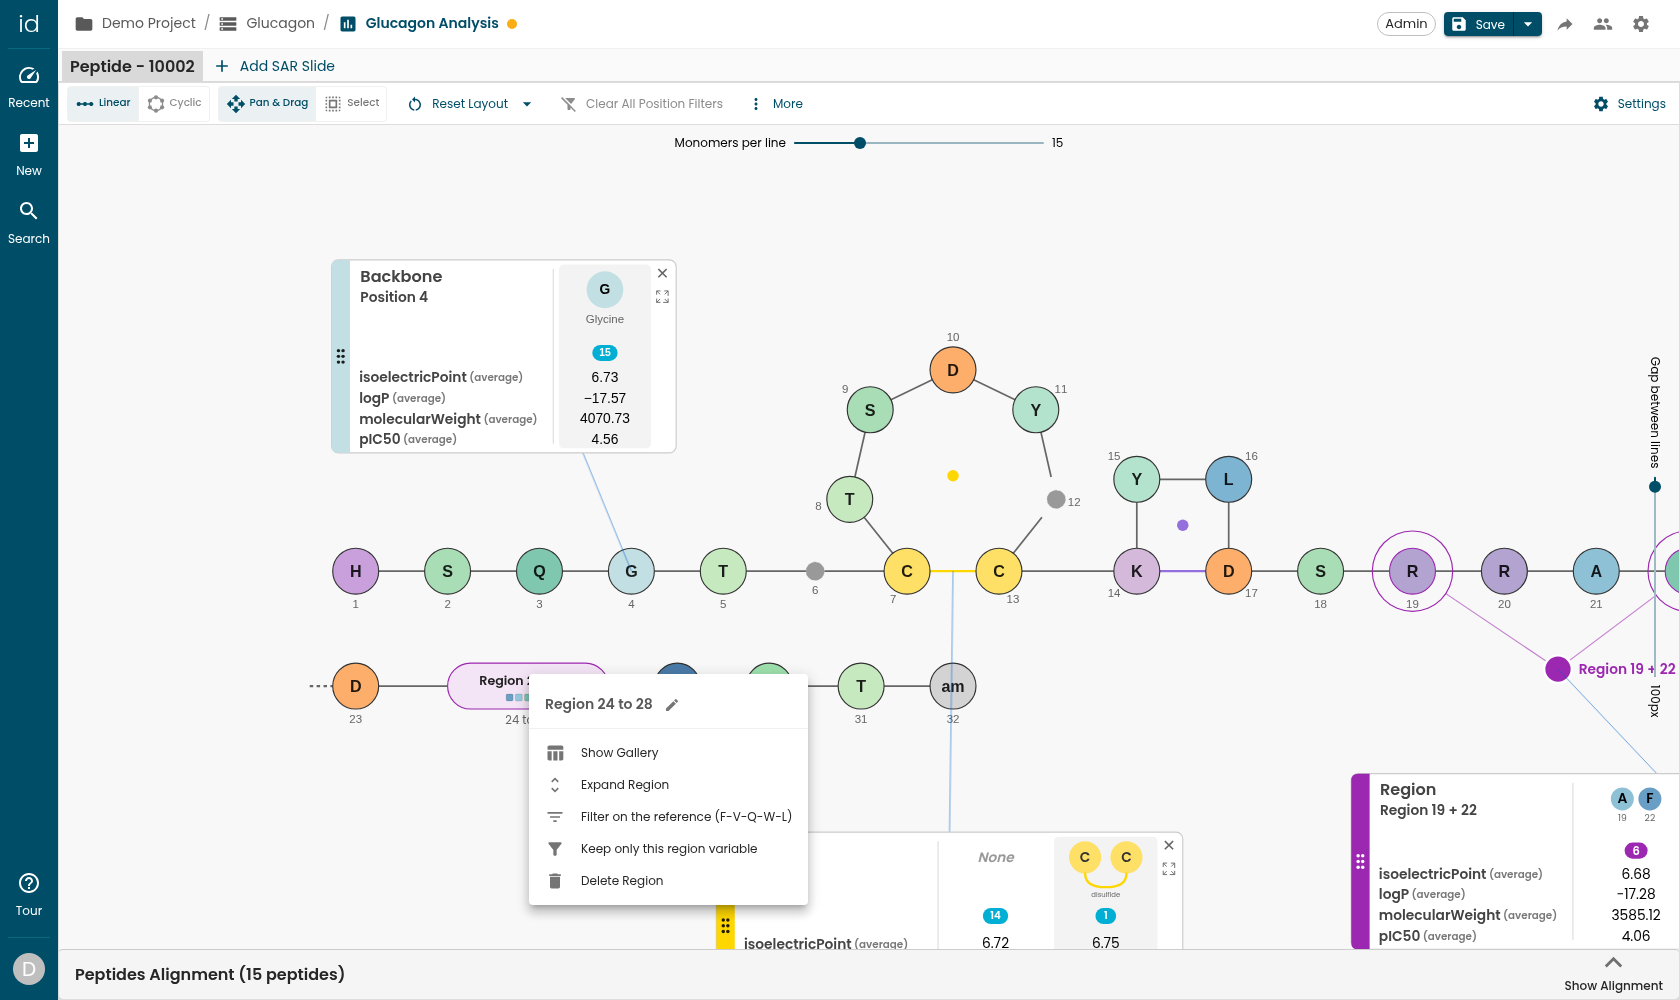
The region context menu offers: rename (pencil), Show Gallery, Expand Region / collapse, Filter on the reference, Keep only this region variable, and Delete Region. The toolbar's Regions menu acts on all of them at once: Collapse All Regions, Expand All Regions, and Delete All Regions for every region you created. Regions can be contiguous (for example Region 24 to 28) or discontiguous (for example Region 19 + 22); on a macrocycle, a region that spans the ring closure counts as contiguous. Auto-generated Branch and synergy regions are managed by the app, and neither delete action touches them.
Read branches and bridges
- Branches are drawn above the backbone with a red connector and a Branch label, as their own numbered chain. They are collapsed by default; expand a branch region to see its monomers.
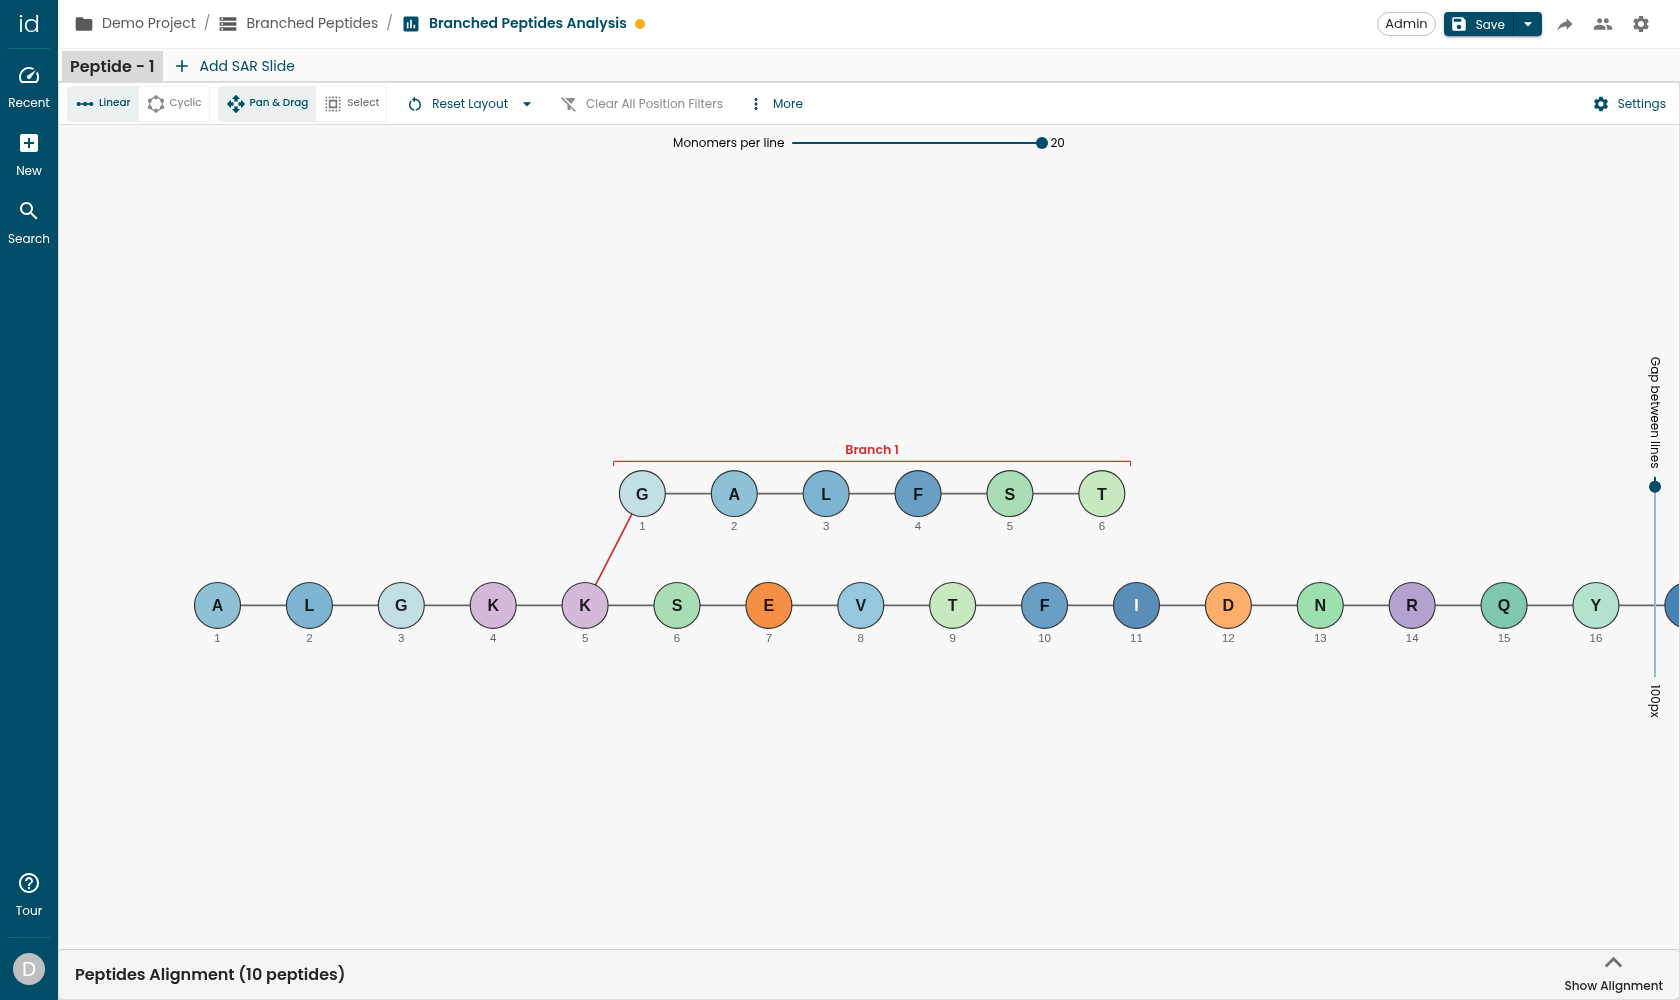
A branch always hangs off the backbone residue's R3, but it can bond through either of its own two ends, and your HELM says which: 3:R3-1:R1 bonds through the branch's first residue (its N-terminal end), 3:R3-3:R2 through its last (its C-terminal end). The viewer follows that. The red connector lands on the residue that actually carries the bond, and the chain then grows away from it — rightwards for a first-residue attachment, leftwards for a last-residue one, instead of crossing back over its own backbone residue. A collapsed branch behaves the same way: the connector points at the square of the bonded residue rather than at the row's first square.
Alignment gaps padding a branch are not residues, so a branch whose first column is a gap still attaches through its first real residue. Where the structure does not say which residue carries the bond, the first one is assumed. None of this is configurable — it is read from the data. The one thing that overrides it is your own hand: a branch you have dragged stays where you put it.
- Bridges are colored arcs between two monomers, colored by type (disulfide, lactam, thioether, and so on — see the Legend tab). Bridges present only in other peptides (not the reference) are drawn dotted/faded and can be toggled with Include Non-Reference Bridges.
Some bridges are not a direct bond but run through a chemical linker — a chemical monomer whose two attachment points each bond to one of the bridged residues. Such a bridge is drawn as the same colored arc with the linker as a node at its middle:
- Expand it from the bridge's right-click menu to draw the linker's chemical structure with its two bridge bonds; collapse it the same way, or use Expand All Linkers / Collapse All Linkers in the toolbar's Bridges menu. An expanded linker is sized to the proportions of its own molecule; drag its corner handle to resize it by hand.
- Drag the node to reshape the bridge — the arc keeps its shape and follows, and the bridge's gallery stays anchored on the node. Like other manual adjustments, the drag is not saved with the layout; Reset Position in the bridge's menu, or Reset Layout, sends the linker back to the middle of its arc.
- Select the node like a monomer (click, or catch it in a rectangle or lasso) to expand, collapse, or reset it together with the rest of the selection.
- Clicking the node opens the bridge's gallery, exactly like clicking the arc.
The linker is not part of the bridge's identity: all bridges between the same two residues are drawn as one bridge, and its gallery shows one variant per flavour — each chemical linker, the direct bridge, and the peptides with no bridge there at all. The linker's name appears in the bridge tooltip, in gallery variant cards (whose bridge symbol carries a small box on its arc marking the linker), and in the peptide list's bridge badges and tooltips. A bridge that only other peptides carry shows its linker as a small dashed marker instead of a full node — hover it for the name — and only when every such peptide bridges through the same linker; with mixed flavours the arc is drawn bare and the gallery tells them apart.
Read side chemical chains
A chemical object is a non-peptide chemistry bonded to a residue's side chain — a PEG spacer, a biotin tag, a cap, a lipid. In HELM it is a CHEM polymer bonded to the residue's R3 (PEPTIDE1,CHEM1,5:R3-1:R1), and a chemical object can in turn carry further chemical objects on its own free attachment points (CHEM1,CHEM2,1:R2-1:R1). Ideation draws the whole chain — or tree, when one object carries several — one node per object, each bonded to its parent with the same dashed attachment-point bond that ties the first object to its residue, growing away from the backbone so nothing overlaps.
Every object of a chain behaves like a single chemical object always has: click it to open its gallery, expand it to see its structure, right-click it for its menu, drag it. Dragging the residue moves its whole chain with it; dragging an object moves that object alone and stretches the bond to its parent, so you can fan a chain out by hand. Reset Position in an object's right-click menu puts it back where the layout places it.
Group and ungroup a chain
A chain of several objects opens grouped: a single pill labelled with its size (3 chems) drawn where the first object sits, still bonded to its residue. To see the individual objects, hover the pill and click its + button, or right-click it and choose Ungroup Chem Chain; Group Chem Chain and the − button fold it again. The toolbar's Chem chains menu does the same for every chain at once (Group All Chains / Ungroup All Chains) and shows or hides the structures of every drawn object (Expand All Chems / Collapse All Chems).
A grouped chain moves as one when dragged, and the galleries and expanded structures of the objects it hides are only put away, not closed: ungroup and they are back. Which chains you ungrouped is saved with the slide. A residue carrying a single chemical object has nothing to group, so it shows no + / − button.
The chain is the variant
A chemistry gallery compares whole chains: one column per distinct chain observed at that residue across the aligned peptides, plus a None column for the peptides with no chemistry there. Two chains made of the same objects wired differently are two columns. Each column header writes the chain in a compact notation read from the residue outwards — K - Tri3Am >R² EG2 >R² AcCap says a lysine carries Tri3Am, whose R2 carries EG2, whose R2 carries AcCap — with each further branch on its own line, and the full notation in the header's tooltip. The same notation names the chain in the enlarged gallery, on chart axes, in filter values, and in the Filter this position on the reference menu item. Hotspot impacts, synergy combinations, and Keep Only Selection Variable use the same whole-chain identity.
A chemical object hangs off a residue's R3, and among the natural amino acids only D, C, E and K have one — HELM validation rejects a CHEM bond to any other natural residue. Two things are not drawn yet: a chain on a residue inside a branch, and a chemical object hanging off a bridge linker's free attachment point. In both cases the rest of the peptide renders normally.
Expand monomers
By default each monomer is drawn as a labelled shape. Expand it — from the selection toolbar, or Expand All Monomers in the toolbar's Monomers menu — to draw its actual chemical structure in place. An expanded chemical object or bridge linker is drawn as its structure inside a thin ring in the node's colour, and the attachment-point atoms keep their element colours.
How large an expanded monomer is drawn is set by the Expanded monomer size slider in Settings → Display. Every expanded monomer you have not resized by hand follows the slider, and moving it resizes them all at once; a monomer you resized with its own handle keeps that size. The slider applies to monomers only — an expanded chemical object keeps its own dimensions.
Read structures without expanding: zoom in
You do not have to expand anything to read the chemistry. Zoom in past a threshold and every collapsed monomer and chemical object in view draws its chemical structure inside its existing bead — with its colored ring, its bonds toward its neighbours, its cap groups, and its symbol tucked at the bottom. Nothing moves or resizes: zoom back out and the symbols return exactly as they were. Explicitly expanded monomers are unaffected and keep their structure at any zoom level.
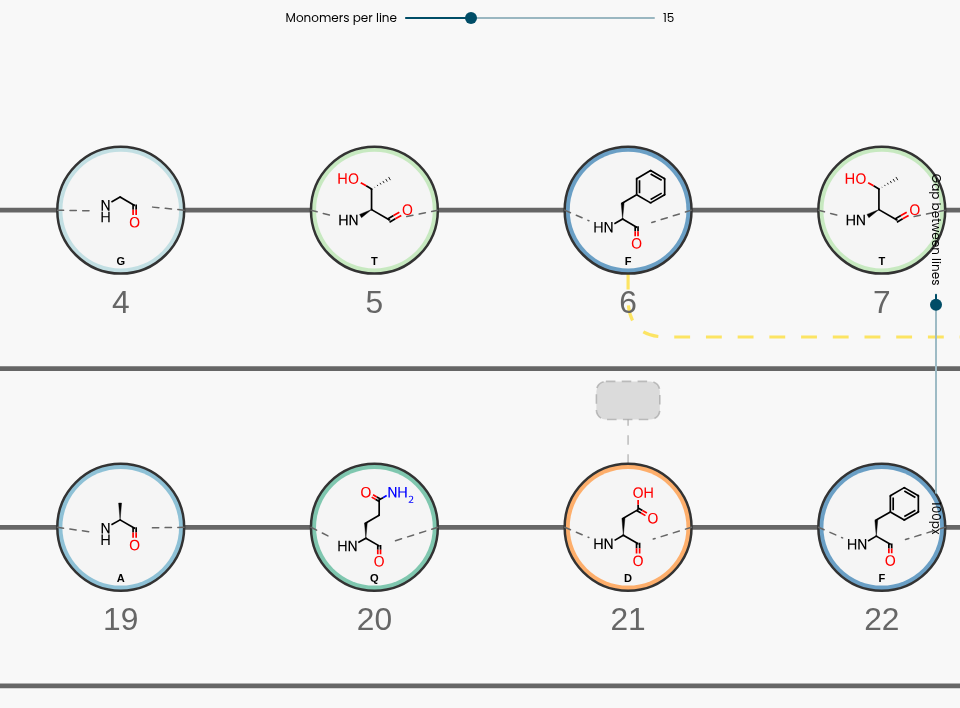
Structures appear live during the zoom gesture and are drawn only for the nodes in view (plus a margin), so the canvas stays fluid on long peptides. The mouse wheel and trackpad zoom wherever the pointer is on the canvas, over a gallery or a node included. When monomers are colored by Amino acid distribution, the pie charts win and no structure is drawn. The behaviour is on by default; turn it off with Show Structures at High Zoom in Settings → Display.
An expanded monomer's free attachment points are drawn with the cap group the Biotoolkit Monomer Service declares for them, so a C-terminal residue reads as the carboxylic acid it is, and an unused side-chain attachment point (a lysine outside any bridge, for example) shows its cap rather than nothing. Attachment points that carry a real bond — to the next residue, to a bridge, to a chemical object — stay drawn as that bond, uncapped. A monomer whose cap group the service does not declare is drawn with an implicit hydrogen, as before.
Cyclize
For a run of monomers joined end-to-end by a bridge, you can lay them out as a ring:
- Select the run and choose Cyclize Selection, or use a bridge's Cyclize menu, or Cyclize All Bridges from the toolbar's Bridges menu.
- A bridge that runs through a chemical linker cyclizes too: the linker takes its own place on the ring, between the two residues it joins.
- A collapsed region inside the ring takes one place on it, as its pill. A collapsed region that hides one of the bridge's residues lays the ring flat on the backbone instead.
- A macrocyclic peptide opens in the circular layout the first time its slide is shown; switch back and forth with the Linear / Cyclic toolbar toggle, which is shown only for macrocycles. A layout you save, or a switch you make, is kept.
- Reverse with Uncyclize / Uncyclize All. Cyclizing is available in the linear layout only.
Open galleries
Click a monomer, bridge, region, or chemical object to open a gallery — a small, draggable table of the variants observed at that element across all aligned peptides, with per-endpoint aggregated values (and deltas when hotspot analysis is on). Use the expand icon to open the enlarged gallery for charts and larger tables.
Choose how an endpoint is summarized
A gallery cell covers several peptides — every peptide carrying that variant at that position — so each endpoint needs a rule for reducing them to one thing to show. That rule is the endpoint's aggregation, and you set it per endpoint.
Open Settings → Endpoints, open the endpoint, and use the Aggregation row on its Details tab. The quicker route is in the gallery itself: the grey suffix after an endpoint's name in the property-label column ((max)) is a button, and it opens the same list.
For a numeric endpoint:
| Aggregation | The cell shows |
|---|---|
| Max / Min | The highest / lowest value. |
| Average / Median | The mean / median. |
| Histogram | A small distribution chart of the cell's values. |
| Boxplot | A small boxplot of the cell's values. |
A text endpoint gets a shorter list, because a mean, a median, a histogram and a boxplot all need the distance between two values and text has none. Those four are not offered at all rather than greyed out:
| Aggregation | The cell shows |
|---|---|
| Most frequent | The value carried by the most peptides in the cell — the default for a text endpoint. A tie is broken alphabetically, so it resolves the same way every time. |
| Max | The last value alphabetically. |
| Min | The first value alphabetically. |
| Bar chart | One bar per distinct value, with how many peptides carry each. Offered only for an endpoint with a bounded set of values — a free-text endpoint such as a peptide name has no category list to draw bars against. |
The bar chart is drawn against the gallery's whole category list and ordered alphabetically, so a category keeps the same slot and the same color in every column of the row and you can read a row across; a category no peptide in that cell carries leaves an empty slot. Hovering a bar names the category and its count. Colors come from the endpoint's own value coloring when it is colored by unique values.
Histogram and Boxplot need at least three values in the cell to be worth drawing. Below that the cell shows a number instead — the average for Histogram, the median for Boxplot.
Aggregation is stored per endpoint. Bar chart and Most frequent are the exceptions: they are kept with the SAR Report rather than on the endpoint itself, so they travel with the report and not with the dataset.
Configure display options
Open Settings → Display to control how the canvas is drawn.
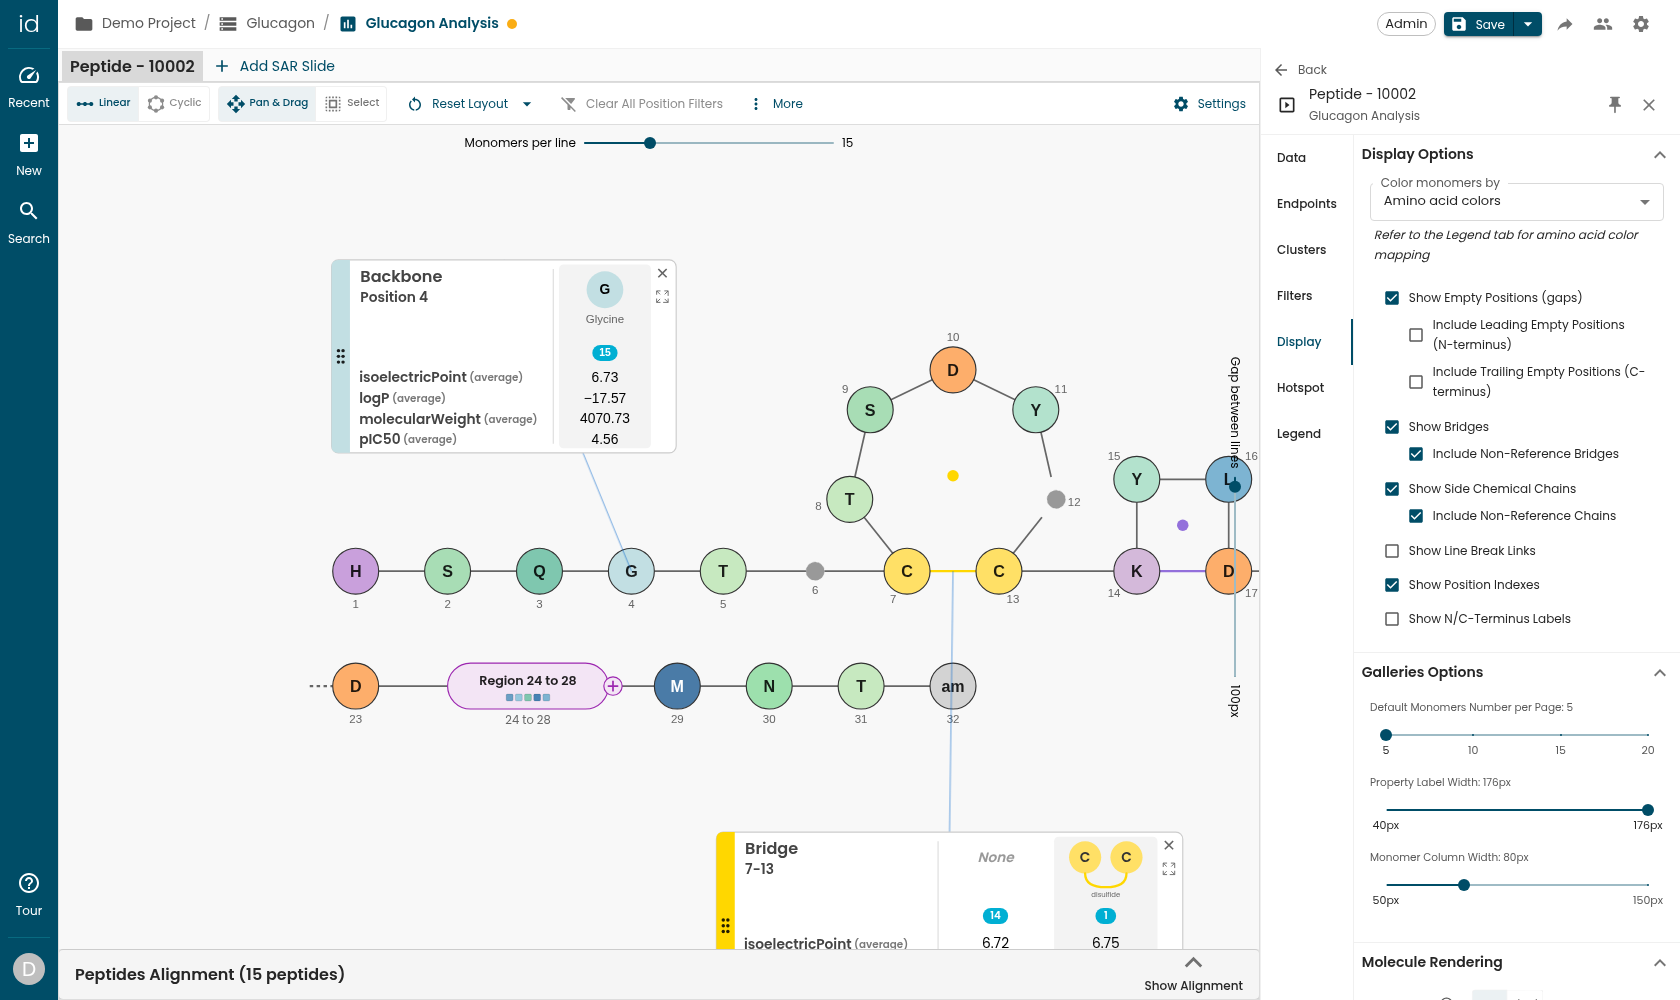
- Color monomers by — Amino acid colors, Number of variants, Popularity (peptide count), Amino acid distribution, or Hotspot (when hotspot analysis is enabled).
- Display toggles — Show Empty Positions (gaps) with N/C-terminus options, Show Bridges (+ Include Non-Reference Bridges), Show Side Chemical Chains (+ Include Non-Reference Chains), Show Line Break Links, Show Position Indexes, Show N/C-Terminus Labels, Enable Smart Guides (snap while dragging), Show Structures at High Zoom.
- Expanded monomer size — the default size of expanded monomers; expanded monomers you have not resized by hand follow it live.
- Galleries Options — default monomers per page, property label width, monomer column width.
Color mappings for amino acids and bridge types are documented on the Legend tab.