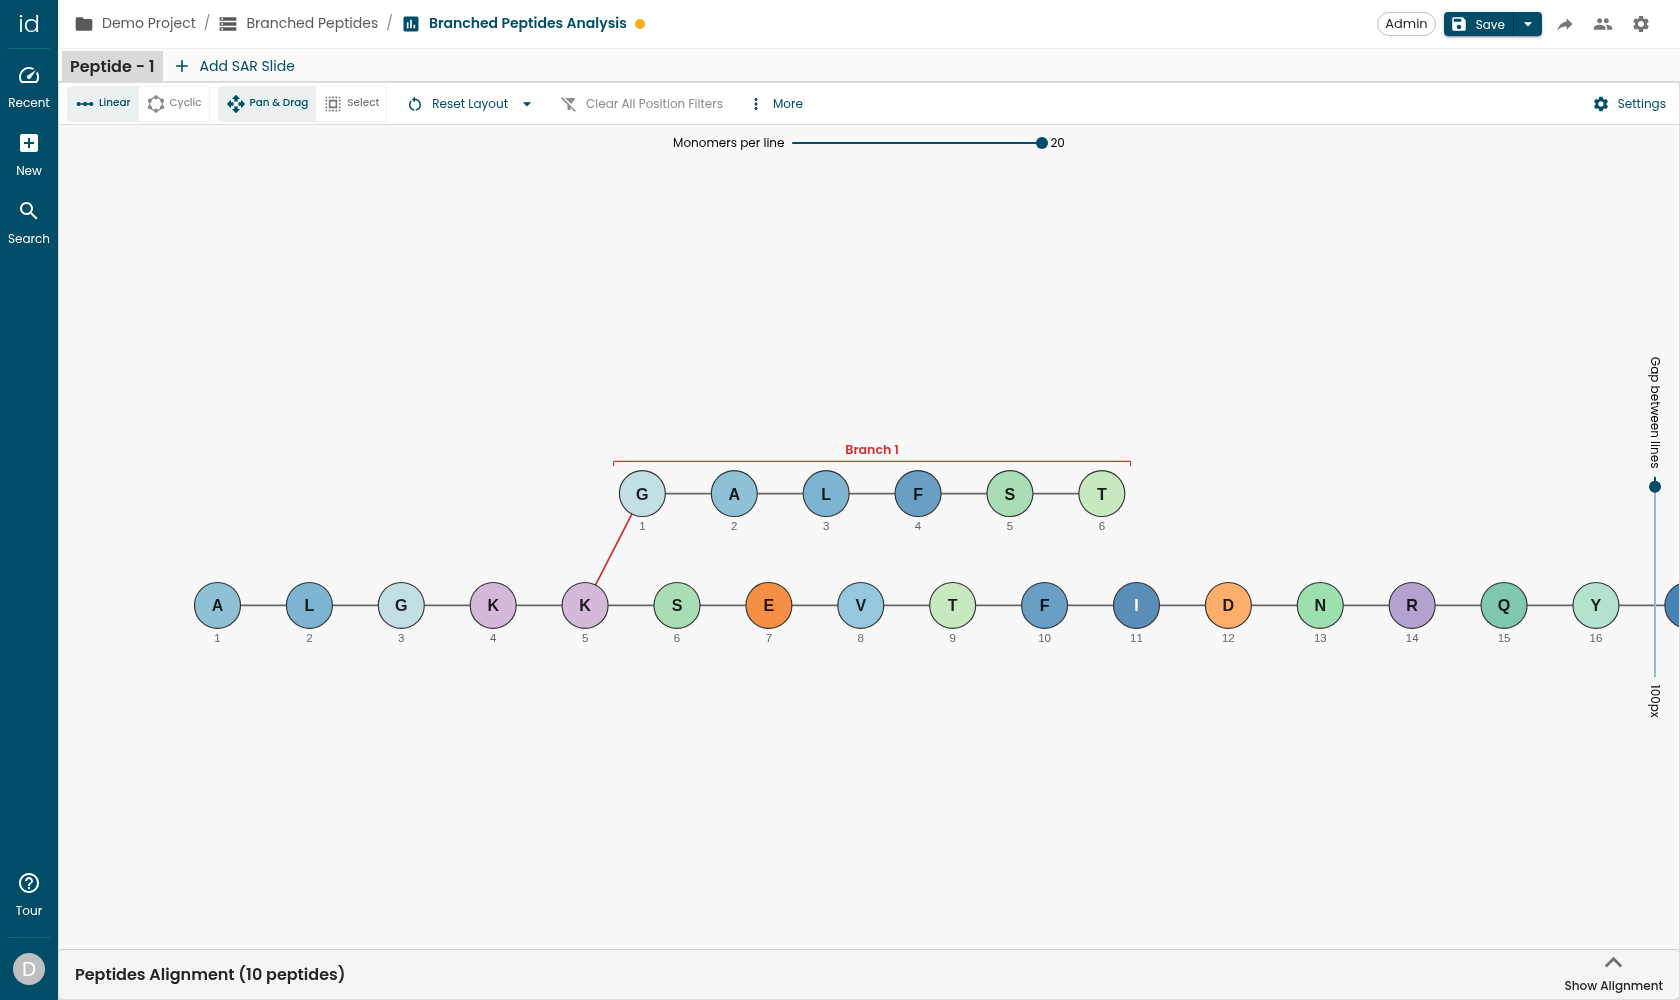
A SAR Report is a workspace that holds one or more SAR Slides. This guide creates a peptide report and its first slide (a viewer built around a reference peptide and an alignment), then shows how to add more slides.
Step 1: Open the Create SAR Report dialog
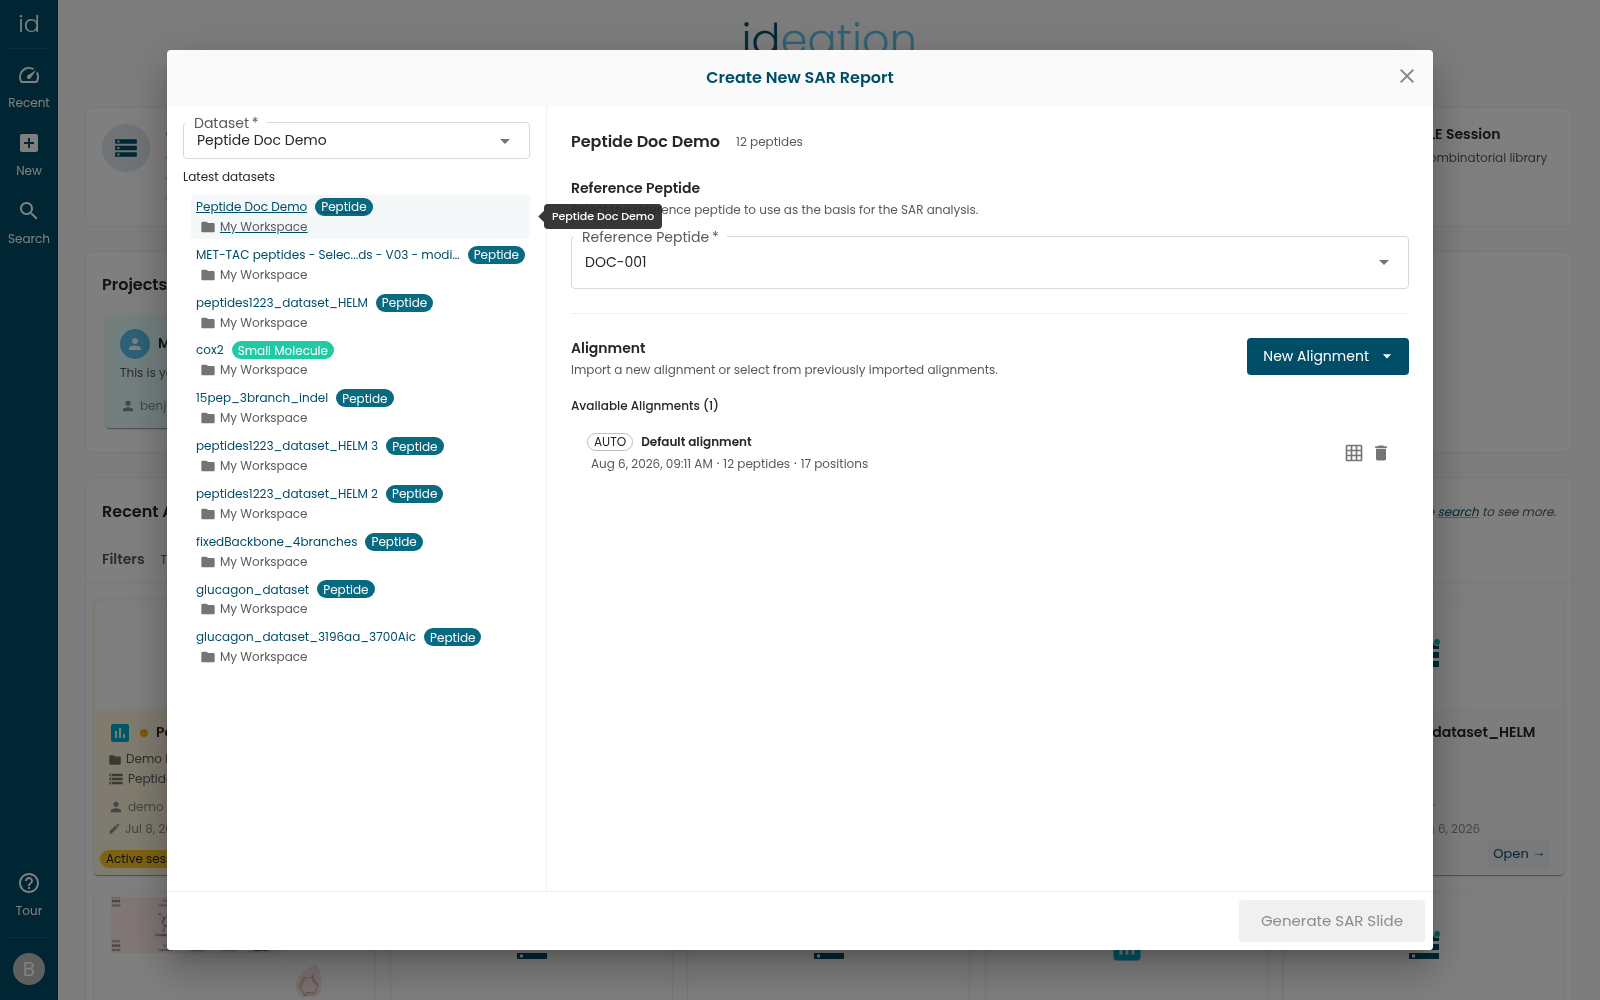
From the Home page click the Create SAR Report card. In the dialog, pick a peptide dataset from the sidebar (peptide datasets are tagged Peptide). When a peptide dataset is selected, the report type is set to peptide automatically and the configuration pane appears on the right.
Step 2: Choose the reference peptide
Under Reference Peptide, select the peptide to use as the basis for the analysis ("Select the reference peptide to use as the basis for the SAR analysis."). If the dataset has a default reference peptide, it is pre-selected — you can change it here.
Step 3: Pick the alignment
Every peptide slide needs an alignment that lines the peptides up position-by-position. The good news is that one is already there: importing a peptide dataset computes an alignment automatically, listed under Available Alignments as Default alignment with an AUTO badge. Select it and move on.
If you would rather use your own, or compute a fresh one, click New Alignment and pick either Import from a file or Generate automatically.
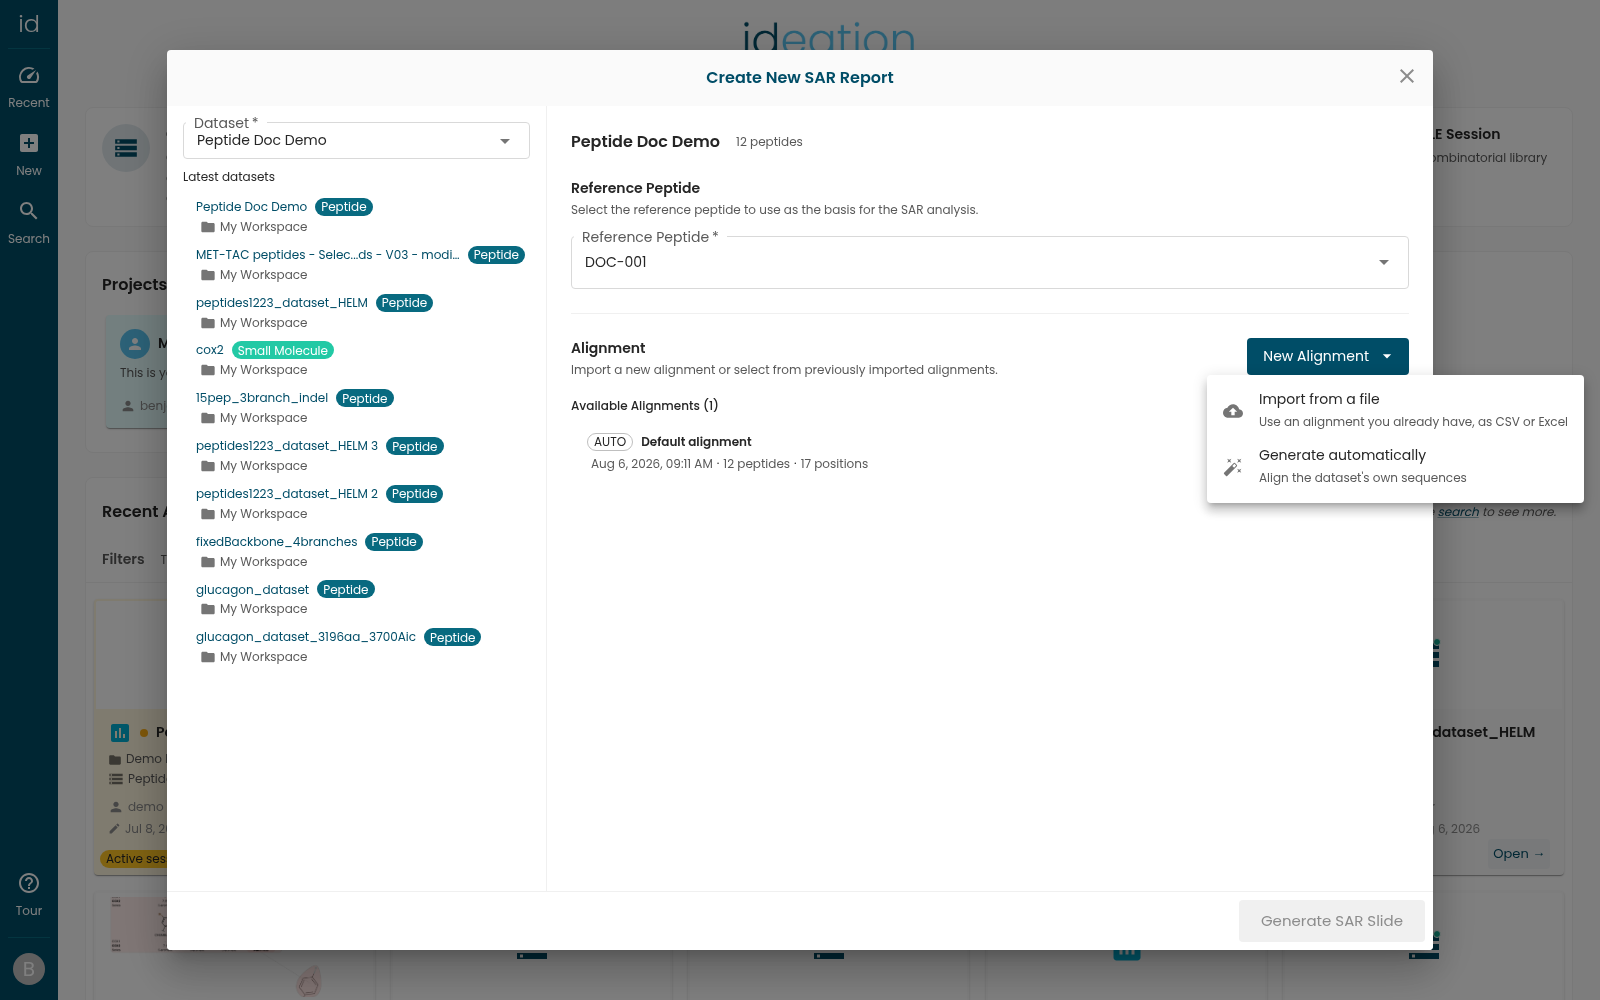
An amber icon on an alignment row means the imported file didn't fully agree with the dataset; the grid icon opens the alignment editor, where sequence mismatches can be repaired.
Alignments belong to the dataset, so every alignment you add here stays available to future reports and slides.
The file format, the Excel backbone/branch sheet steps, what each import warning means, and how to fix a sequence mismatch are covered in How to Align Peptides.
Step 4: Generate the first slide
With a reference peptide and an alignment selected, click Generate SAR Slide. The report opens with its first slide in the peptide viewer.
Step 5: Add more slides (optional)
Inside an open report, use the Add SAR Slide button in the tab bar to create another slide in a new tab — for example with a different reference peptide or a different alignment — so you can compare views within the same report. Existing slides can also be duplicated.